An online school in Almaty sells an analytics course for 25,000 ₸ and has already ranked the hypotheses for its landing page with ICE. Now the ideas on the table at the weekly meeting are bigger. The marketer wants a free mini-course in Telegram and is sure it will bring in the most students. The manager suggests messaging people on WhatsApp who submitted the form but never paid. The director is thinking about letting people pay in two instalments. The mini-course would tie up two people for two months, the reminders a couple of weeks, and the argument about where to start keeps going round in circles. The school's numbers in this lesson are made up.
What ICE is missing
How to score ideas with ICE is covered in hypotheses for a landing page: three scores from 1 to 10, Impact, Confidence and Ease, and the total is their average: ICE = (Impact + Confidence + Ease) / 3. That is also how GrowthHackers describes the method. For edits to a single page it's enough. For the school's new ideas it isn't, for two reasons.
The first is reach. In ICE, the Impact score answers two questions at once: how many people the change will touch and how much it will change each of them. On a landing page you can live with that, because every hypothesis is about the same visitors. Here, though, the reminder goes only to people who submitted the form and didn't pay, the mini-course goes to new people from ads, and the instalment option is offered to everyone who gets as far as talking about the price. Whoever assigns Impact has to estimate the size of each group in their head.
The second is effort. In ICE the scores are added up, so a big impact papers over heavy work. An idea with Impact 9 and Ease 2 gets the same total as one with Impact 5 and Ease 6, as long as their confidence is the same. The reminder and the mini-course differ eightfold in effort, and all ICE keeps of that is Ease 9 against 2, which after dividing by three is just over two points.
RICE: four estimates and a formula
RICE was described by Sean McBride at Intercom, and the scales below come from his article.
- Reach - how many people or events the change will affect in a chosen period. At Intercom they count customers per quarter. The number comes from data: your CRM, GA4, your customer base.
- Impact - how much the change will move the goal for each person it touches. The scale is fixed: 3 is massive, 2 high, 1 medium, 0.5 low, 0.25 minimal.
- Confidence - how well the reach, impact and effort estimates are backed by data. 100% is high confidence, 80% medium, 50% low. Intercom calls anything below that a total moonshot.
- Effort - how much work the idea will take from everyone involved, in person-months. Intercom recommends whole numbers and a minimum of half a month, without getting lost in precision.
The formula: RICE = Reach × Impact × Confidence / Effort. The result shows how much benefit you get per month of work. Effort divides the result here instead of being averaged with the other scores: an idea that needs four times the work gets a quarter of the score.
The school's three ideas in RICE
The school's goal for the quarter is more course payments. All ideas share one horizon, a quarter, and reach is counted in people. According to the CRM, the school gets about 65 leads and 15 payments a week. Over a quarter that is about 850 leads, 195 payments and 650 people who never pay.
| Idea | Reach per quarter | Impact | Confidence | Effort | RICE |
|---|---|---|---|---|---|
| A: a WhatsApp reminder to people who haven't paid within three days | 650 | 1 | 80% | 0.5 | 1,040 |
| B: paying in two instalments of 12,500 ₸ | 850 | 0.5 | 80% | 1 | 340 |
| C: a free three-lesson mini-course in Telegram | 1,000 | 2 | 50% | 4 | 250 |
A, the reminder. Reach is the 650 people who will submit the form this quarter and not pay. Impact is medium. Confidence is 80%: the CRM shows that only a handful of people who haven't paid in the first three days pay later. In September the manager messaged 30 of them by hand: 18 replied with questions about the schedule and payment, and four went on to pay. But all thirty got a message, and nobody knows how many would have paid without one, so confidence is medium rather than high. Half a month of work: the message text and a CRM rule for whom to write to and on which day.
B, instalments. Reach is all 850 people who submit the form, since the manager discusses the price with every one of them. Impact is low: 25,000 ₸ doesn't stop everyone. Confidence is 80%: over the quarter, 40 people asked on WhatsApp about paying in instalments. A month of work: the contract, tracking second payments and reminders about them.
C, the mini-course. A reach of 1,000 bot subscribers is a guess; the school has no data of its own. High impact is a guess too, based on what competitors say. So confidence is low, 50%. Four person-months of work: two people spend two months writing the script, recording three lessons, and building the bot and the ad creatives.
The numbers. A: 650 × 1 × 0.8 / 0.5 = 1,040. B: 850 × 0.5 × 0.8 / 1 = 340. C: 1,000 × 2 × 0.5 / 4 = 250.
The reminder comes first by a wide margin: it has the smallest reach, but it's only half a month of work. The mini-course comes last even though it promises the most: low confidence and four person-months ate its high impact.
In ICE the team gave these ideas 7.7 (Impact 6, Confidence 8, Ease 9), 5.7 (5, 6, 6) and 4.7 (9, 3, 2). The order is the same, but three points between the first and the last idea look like a difference of taste you could argue about for another hour. In RICE the gap is more than fourfold, and the argument can now be about numbers: 650 people from the CRM against 1,000 subscribers who don't exist yet.
Little evidence and a lot of work
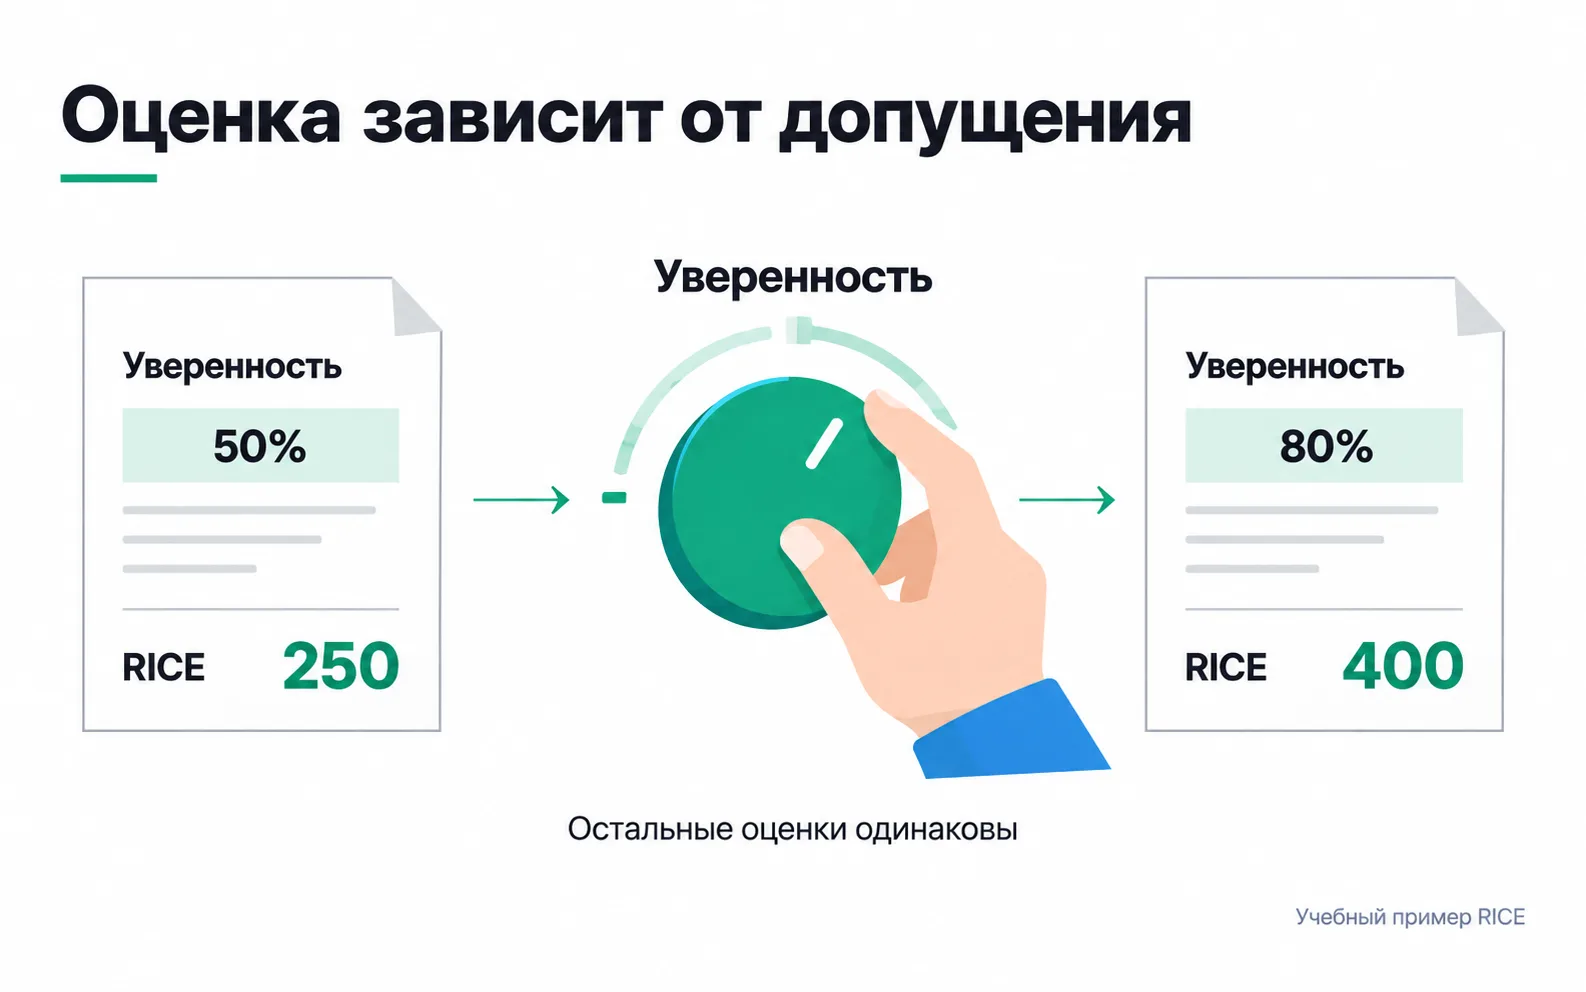
Now the mini-course. Its 250 rests on a confidence estimate nobody has checked. If the data justified 80%, the score would be 1,000 × 2 × 0.8 / 4 = 400, and the mini-course would overtake instalments. If the work stretches to six person-months, the score drops to 167. One estimate decides the idea's place in the queue, and that is what the picture shows.
There are two ways to get an idea like this wrong. Put it first for its big promise, even though a promise with no evidence is easy to inflate and a miss costs four person-months. Or drop it because it's uncertain. But uncertainty can be reduced, and here that is eight times cheaper than the idea itself.
So the order is this. Score confidence and effort from data, not from the promise. Find the key assumption the idea rests on. The mini-course has one: people who watched free lessons go on to buy the course. If the idea's place in the queue depends on that assumption, test it first.
For the school, the test is a single open lesson streamed live. People are invited from the same ads, and two weeks later the school counts how many of those who came paid for the course. That's half a month of one person's work. The threshold is written down before the stream: if at least one in five who came pays, close to the rate for ordinary leads, confidence goes up to 80%; if fewer than one in twenty pay, the mini-course is shelved; anything in between means a second stream, with confidence staying at 50%. Without a threshold set in advance, any result will look encouraging after the stream.
Turning the confidence dial so that a favourite idea overtakes its neighbour is pointless: you might as well not score at all. ICE and RICE exist to compare ideas on several criteria at once, not on one promised effect. Confidence changes with data, not with the argument at the meeting.
When RICE, when ICE
RICE is worth the extra minutes of scoring when:
- the ideas touch different groups of people, and you can count each group from your CRM or GA4;
- the ideas range from weeks to months of work;
- the list is for a quarter and several people argue about it.
ICE is more convenient when:
- every hypothesis is about one page and one audience, like edits to a landing page;
- each edit takes hours or days;
- you need to choose in fifteen minutes for the next short HADI cycle;
- there's nothing to count reach from. Then RICE gives false precision: "1,000 people" in a table looks more solid than a guess, even though that's exactly what it is.
Four checks before you sort
- One horizon. Reach for every idea is counted over the same period: 650 people per quarter and 300 per month can't be compared. Nor can you just multiply monthly users by three: someone who visits every month gets counted three times. Take unique people for the whole quarter.
- One unit and one funnel stage. People, sessions, leads and payments don't add up. And don't put ideas for site visitors and ideas for people who submitted the form on the same list. The school's landing page gets about 2,500 visits a week, about 32,000 over a quarter, more than thirty times the number of leads. But there is roughly one payment per 170 visits, while roughly one lead in four pays. The Impact scale doesn't see that difference: an impact of 1 on a visitor and on a lead means very different numbers of payments. Keep landing page edits on a separate list and score them with ICE.
- All the work. Effort covers everyone: copy, design, development, testing, support after launch. Two people for half a month each is one person-month, even though two weeks have passed on the calendar. Never put zero: "the code is already written" doesn't remove the launch, testing and maintenance, and the formula can't divide by zero.
- Dependencies and must-dos. Intercom itself says RICE isn't a hard and fast rule. If instalments need a new contract and the lawyer can only look at it in a month, a high score won't make it ready to launch tomorrow. And anything broken, say a payment form that won't open on a phone, gets fixed straight away and never goes into the queue.
Exercise: RICE for your own ideas
Take a project you run ads for: the landing page from the Start track or a client's. You need three to five ideas beyond the landing page: how to reply to leads, how to follow up, how to take payment, how to sell again.
The review starts with the "where the number came from" column. If the reach there says "rough guess", that idea's confidence is no higher than 50%, however solid it feels. If one idea's reach is counted per month and another's per quarter, or one row counts people and another counts leads, it's too early to sort the table. And move any landing page edit with a reach of thousands of visitors to your ICE list: next to ideas about leads it will look stronger than it is.
The last item is the most useful one. If the low-confidence idea stays in its place at 80%, there's no point testing it now: the decision doesn't depend on that estimate. If it climbs above its neighbour, you have your first experiment of the quarter, and it costs half a month rather than the whole idea.
Video: an overview of the two methods
Ruslan Sharipov on prioritising product features with RICE and ICE. The video is in Russian.