Six months after piloting its intensive, an IELTS prep centre in Almaty has three products: the main Academic course, an evening General Training group and a pre-exam intensive. In the spring eight people signed up for General Training, and the centre opened an evening group, just as it had written in its SWOT. Now the owner is deciding where to put the ad money and the teachers' hours. A partner brings a slide calling the intensive a "star" because it gained 50% more participants over the quarter. But on the BCG matrix, growth in your own sales sits on neither axis.
The matrix comes from the Boston Consulting Group. According to the history on BCG's website, Alan Zakon first sketched it, and Bruce Henderson made it famous in his 1970 essay "The Product Portfolio". Each product is placed on two axes: its relative share of its market and the growth rate of that market. The competitors' shares, the Google Trends indices and all of the centre's figures are illustrative.
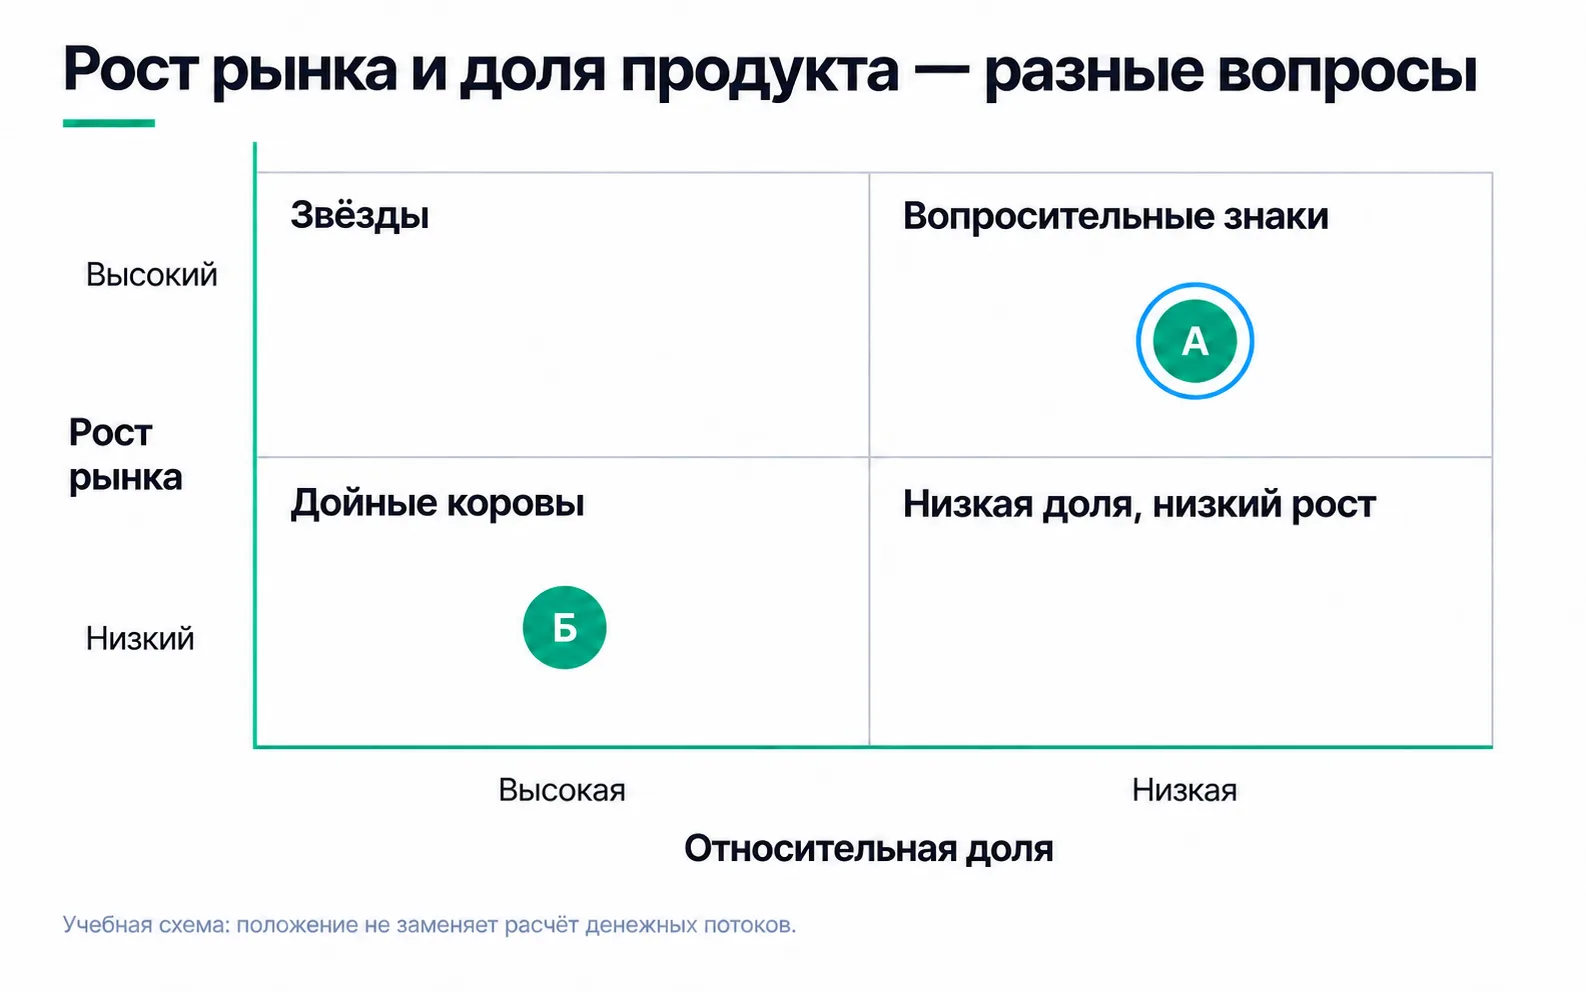
On the chart, A is the General Training group and B is the Academic course. Why they sit where they do is worked out below.
Relative share: you against the largest competitor
Relative share is your sales divided by the sales of the largest competitor in the same market. If you are the largest, divide by the second. Above one, you lead; below one, someone sells more than you.
The market has to be the same for you and for the competitor: you cannot divide the centre's local sales by the sales of a chain with branches in three cities. The centre used students per month as the unit, because it only roughly knows competitors' prices. Nobody publishes competitors' sales, so they are estimated from what can be seen from outside: group timetables on Instagram and 2GIS, the number of seats, mock exam announcements. Next to each estimate, write down how you got it.
| Product | Market | Centre's students per month | Largest competitor and how it was estimated | Relative share |
|---|---|---|---|---|
| Academic course | Group IELTS Academic preparation in Almaty | 40 | "7.0 Guarantee": four groups of eight seats on its timetable, 32 at most | 40 / 32 = 1.25 |
| General Training | IELTS General Training preparation in Almaty | 8 | Language school: two IELTS groups of 12 seats with mixed goals, about 16 of them relocating, judging by reviews | 8 / 16 = 0.5 |
| Intensive | Mock exams and short IELTS preparation in Almaty | 10 | "7.0 Guarantee": a mock exam every Saturday with 10 seats; if each person comes once, about 40 people | 10 / 40 = 0.25 |
Write the market boundary down before you count. Narrow the Academic market to "applicants to British universities who have an exam date" and the centre becomes the leader simply because nobody will find a largest competitor inside such a narrow frame. A share obtained by moving the boundary says nothing about the product.
Market growth: not your sales
Market growth is how much the whole market grew over a year, regardless of how your product did. The centre has no ready figures for IELTS preparation in Almaty, so it takes a rough estimate from Google Trends. Trends divides the number of searches on a topic by all searches in the region over the same time and scales the result from 0 to 100 (how Trends calculates its data). That is a share of interest rather than a number of people, so the figure gets labelled "Trends estimate".
Take both years in one query covering 24 months and compare the averages of the first and last 12 months: two separate queries would each get a scale of their own. The centre got this: "IELTS Academic" was 50 last year and 53 this year, 6% growth, and "IELTS General Training" went from 20 to 25, 25% growth. The index covers all of Kazakhstan while the centre's market is Almaty, because for a single city a rare term like "IELTS General Training" can come back as nothing but zeros. The intensive has no search term of its own, and the growth of its market is unknown.
BCG's page names no threshold for high growth. Choose one in advance, before you work out the products: in the example it is 10% a year. If you move the threshold after counting, the product lands wherever someone wanted to see it.
As for the 50% on the partner's slide, that is the growth of the intensive's own sales. It says nothing about its market.
The four quadrants
| Quadrant | Growth and share | What BCG advises | The question for a small business |
|---|---|---|---|
| Stars | High growth, share above 1 | Invest significantly | Are there enough people and money to hold the lead in a growing market? |
| Cash cows | Low growth, share above 1 | Milk them for cash to reinvest in other products | How much does the product return after ads, and will it break if you take everything? |
| Question marks | High growth, share below 1 | Invest or discard, depending on the chances of becoming a star | Is there a testable path to leadership, and what will be the signal to stop? |
| Dogs (BCG calls them pets) | Low growth, share below 1 | Liquidate, divest or reposition | Does another product depend on this one? |
The Academic course, with a share of 1.25 and growth of 6%, is a cash cow, B on the chart. General Training, with a share of 0.5 and growth of 25%, is a question mark, A on the chart. The intensive does not go on the matrix: its share of 0.25 has been worked out, its market growth has not, and a point with one invented axis is worse than an empty cell. Either way it is far from being a star: by this estimate, four times as many people sit the "7.0 Guarantee" mock exams.
Check the conclusion against the money
A quadrant suggests which question to ask, but it does not say how much a product earns. Let's work out contribution after ads per student. The centre gets 16,000 ₸ a month only from students who pay, and not all of them reach the third month, so contribution per course is taken from the August intake: 40,000 ₸ per student, not 48,000 ₸. General Training has no retention data of its own yet, so it gets the same figure. If the owner still spends half of the contribution on ads, the limit per student is now 20,000 ₸. The eight students in the General Training group came without dedicated ads, so the ad cost per student comes from tagging 120 leads by the customer's task at 2,000 ₸ per lead.
| Product | Contribution per course | Ads per student | Contribution after ads |
|---|---|---|---|
| Academic course | 40,000 ₸ | About 11,400 ₸: 7 payments from 40 leads | About 28,600 ₸ |
| General Training | 40,000 ₸ | 30,000 ₸: 2 payments from 30 leads | 10,000 ₸ |
| Intensive | 30,000 ₸ | Not counted | Unknown |
General Training has only two payments, and a third would bring the cost per student down to 20,000 ₸, exactly the limit. With numbers this small, the only safe statement is that this product does not look cheaper than Academic so far.
BCG explains the strength of a leader by saying that market leadership brings a self-reinforcing cost advantage that competitors find hard to replicate. The centre gets no such advantage. Having 40 students instead of 32 makes no teacher hour cheaper: every group of eight needs its own teacher. The cash cow's money here comes from applicants who are cheap to attract, and scale has nothing to do with it. That is the main trap of BCG for a small service business: share barely affects costs, and you can only estimate it by eye.
The products are also linked. Some intensive participants later buy the full course, and the General Training group takes up the evenings of the same teachers. During the pilot the centre counted moves to the full course, then stopped, and without that number the intensive's fate can't be settled. Closing it on the strength of the matrix alone would be a mistake.
A decision for each product
- Academic course. Leave the price alone, protect retention to the third month and the senior teacher's time. The course's contribution pays for testing General Training.
- General Training. To overtake the language school the group needs more than 16 students, so 9 more. At the current 30,000 ₸ per student that is about 270,000 ₸ of advertising. But those 30,000 ₸ came from general ads aimed at everyone, and ads written for people relocating may cost something different. The centre runs a three-month test with a stop condition: if a student costs more than 20,000 ₸ for two months running, or a second group has not filled by the end of the test, the money goes back to Academic.
- Intensive. It has no quadrant yet, so the decision rests on its own economics: 30,000 ₸ of contribution per participant and the senior teacher's hours.
If you know nothing about competitors' shares, call the table a portfolio review rather than a BCG matrix. You can compare products' profitability and their own growth without shares; you just won't get quadrants out of it.
Exercise: your own sales growth and market growth
Three months later General Training has 12 students instead of 8, already two groups, 50% more. The owner writes: "Now it's a star." Over the same period the language school went from 16 to 24 such students, and the Trends index is growing at the same pace as before, about 25% a year. Is the owner right? Then do the same for your own products:
The owner is wrong. The General Training share was 8 / 16 = 0.5 and stayed at 12 / 24 = 0.5: the centre grew exactly as fast as the leader, and its position did not move. The product becomes a star when its share goes above one, that is, when it has more students than the school. The 50% is growth in the centre's own sales, and the market is still growing fast, so General Training remains a question mark.
The opposite happens too. If your sales grew by 20% while the whole market grew by 40%, your market share fell: the new share is 1.2 / 1.4 ≈ 0.857 of the old one, about 14% lower. Your own growth means nothing without the market's growth next to it.
In your own table, look at the "how it was estimated" column. If a product has a share and that column is empty, what you have is a wish rather than an estimate. A quadrant built on it is better removed than defended.
Video: product portfolio analysis
Before you put your own product on the chart, write down the market, the source and the date of each estimate.