On Monday an IELTS prep centre in Almaty changed the sign-up form for its free trial lesson: out of four fields it kept two, name and WhatsApp number. That same Monday the owner launched a promo: 10% off the first month for anyone who signs up before the end of the month. In the two weeks before the changes, 600 people opened the course page and left 30 leads, which is 5%. In the two weeks after, the same number of people left 48 leads, now 8% (the numbers in this lesson are an example). The marketer writes in the report that "the new form delivered +60%", and the owner is sure it was the promo.
Going by these two fortnights, either of them could be right. The form and the promo started on the same day, so the growth after Monday could be put down to either one. Add the season: closer to exam dates there may be more people ready to sign up with no changes at all. A before-and-after comparison shows that conversion went up, but not what pushed it up.
What an A/B test does
In an A/B test, visitors arriving on the same days are split at random into two groups. Group A sees the old form, group B the new one, and the promo, the season and the ads are the same for both. Then the difference between the groups is the effect of the form plus chance, and chance can be estimated with statistics.
To check the form's own contribution, the centre needs an A/B test planned in advance: the metric, the sample size and the stopping rule are written down before anyone looks at the first numbers. Decide them on the fly and your decisions will start bending toward the growth you want to see.
Which hypothesis to test first is something conversion rate optimisation (CRO) helps you decide, and this lesson is about testing one of them.
The test plan before launch
The centre's plan fits in a table:
| Item | The centre's decision |
|---|---|
| What changes | The form: two fields instead of four, the rest of the page stays the same |
| Who is split | Course page visitors, at random, half and half |
| Primary metric | Share of visitors whose lead the server accepted (generate_lead) |
| Guardrail metric | Share of leads who replied to the manager on WhatsApp |
| Sample | 894 visitors per variant |
| Stopping | After six full weeks, earlier only if something breaks |
| Decision | Keep the new form if the difference is significant at α 5% and the reply rate in group B is at least 55% |
The guardrail metric is there because a short form can bring in people who left a number in passing and won't answer a message. Leads go up, students don't. In the week 2 test 7 people out of 11 replied to the manager, about 64%. The 55% threshold leaves a margin, because with eleven leads that share is only a rough figure.
The split has to be done by code, not by a person. A developer or an A/B testing service assigns the variant at random, stores it in a cookie so a returning visitor sees the same form, and sends the variant to GA4 as a parameter with page_view and generate_lead, for example form_variant. The parameter has to be registered in GA4, or it won't show up in reports. GA4 doesn't run tests itself: Google suggests connecting a third-party tool and reading the results in its reports. A cookie split has its limits: the same person on a phone and on a laptop can land in different groups, and Safari keeps cookies set by a script for seven days, so someone who comes back two weeks later may see the other form.
Splitting by day or by channel won't work. If Instagram leads to form A and Google to form B, the difference between the groups is the difference between audiences, and the form gets lost in it.
How many visitors you need
Open the calculators and go to the A/B test planner tab. The baseline conversion rate is 5%. The calculator takes the minimum detectable effect relative to the baseline, so going from 5% to 8% is 60%: enter 60 in the minimum detectable effect field. A significance level of 5%, power of 80% and two variants are the defaults. Under the effect, the calculator will confirm that the test is 5% against 8%.
Here is what those settings mean. A 5% significance level means you accept that in one test out of twenty you'll declare a winner where there is no difference. 80% power means that if the new form really does lift conversion to 8%, the test will catch it four times out of five.
The calculator shows a sample per variant of 894 and a total sample of 1,788. It uses a two-proportion z-test, as its fine print says. The centre's course page gets about 300 visitors a week from all sources, or 43 a day: enter 43 in the daily traffic field. At that traffic the calculator comes out at 42 days, exactly six weeks. Its verdict is "four to eight weeks": you can run it, but the promo will end in the meantime, and the test will cover days with and without it.
The sample grows fast as the effect shrinks. To tell 5% from 6%, the calculator asks for 7,664 visitors per variant. If you don't have the traffic for that, test changes that could have a large effect, or move the test to a funnel step with more events.
When to stop the test
On day five each group has 100 people: 5 leads in A, 8 in B. The owner asks to stop the test and keep the new form.
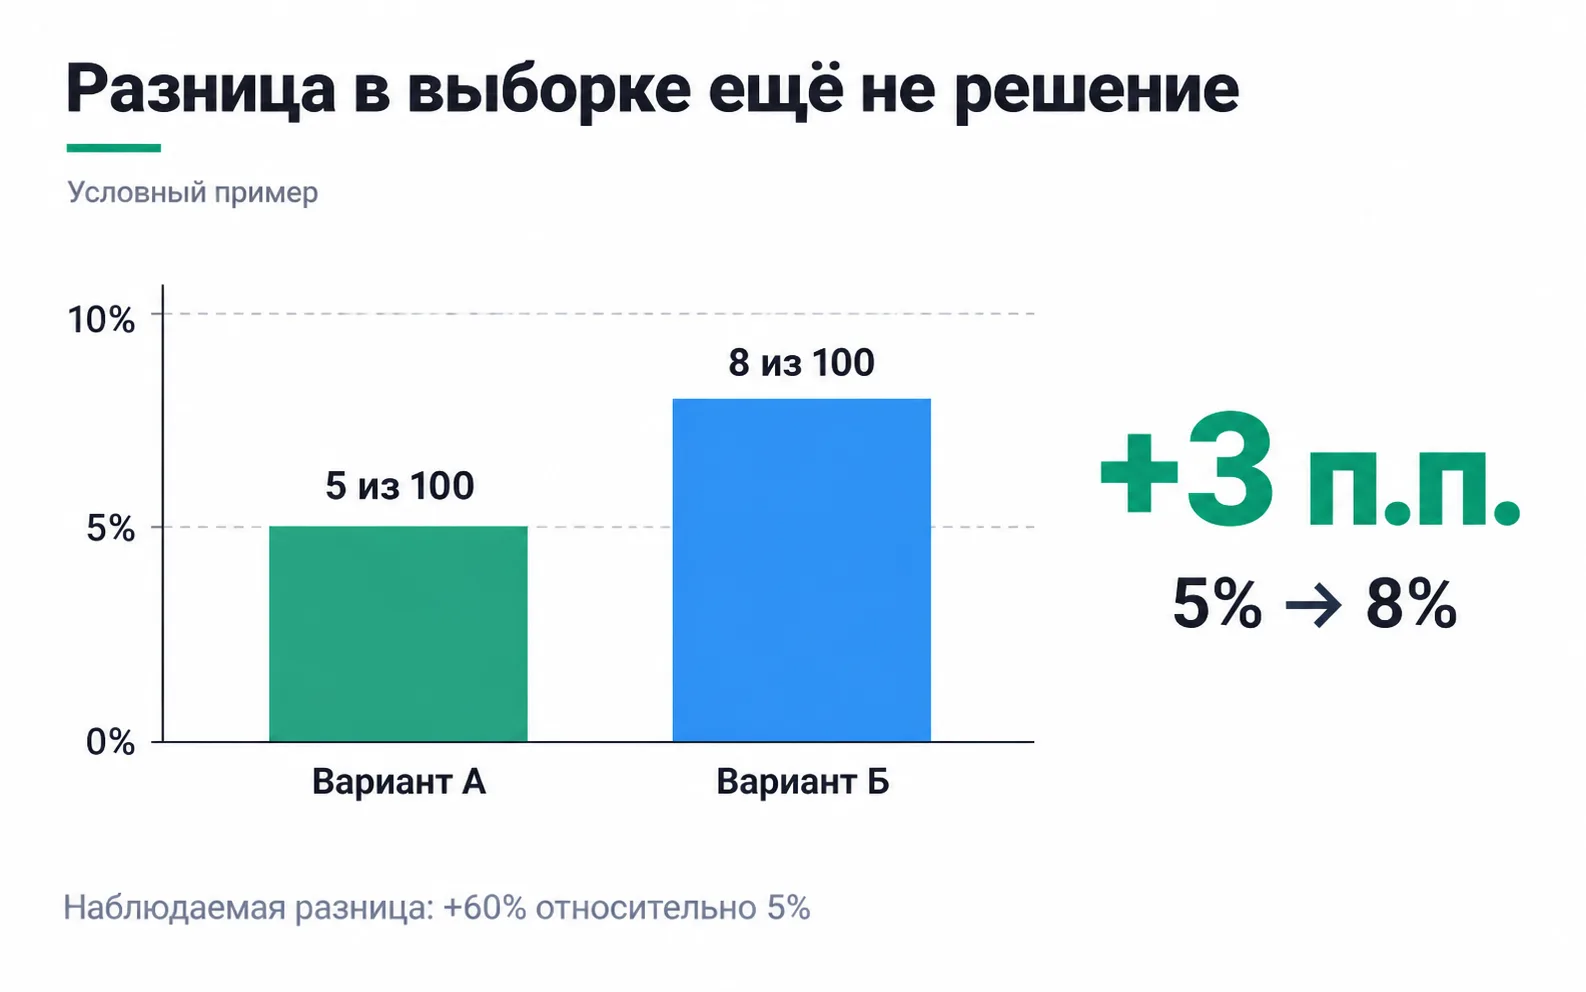
It's the same 3 pp difference the test was set up to find, but on a hundred people you can't tell it from chance. Enter these numbers into Evan Miller's chi-squared calculator, and it will tell you there's no significant difference. A 95% interval for the difference, that is, the difference ± 1.96 standard errors, runs from -3.8 to +9.8 pp: the data fit a form that is 4 points worse than the old one just as well as one that is 10 points better.
You can't look at the numbers every day and stop the moment the difference turns significant. Peeking like that pushes false wins above the 5% you planned for: random swings move the difference in and out of significance even when there's no effect. That's why the stop date is in the plan from the start. Sequential tests do allow peeking, but you pick such a method before launch, not after an inconvenient result.
A test is stopped early only when something breaks: form B won't submit on an iPhone, or leads aren't reaching the manager. Then you fix the problem and start the test over, without declaring a winner.
What to check before reading the result
After six weeks group A has 903 people and group B has 897. With a fifty-fifty split, that's what you'd expect. Had it come out 980 and 820, it would be too early to read the leads. A skew like that is called Sample Ratio Mismatch, and you shouldn't draw conclusions from a test that has it until you find the cause. For example, variant B loads more slowly and some people leave before they're counted, or the split script doesn't run in some browser.
The second condition is the same measurement in both groups. generate_lead in both forms must fire on the server's response, not on the click. Run both forms through DebugView before launch, and at the end compare the lead count in GA4 with the manager's list for each group.
How to read the result
| Group | Visitors | Leads | Conversion | Replied on WhatsApp |
|---|---|---|---|---|
| A, old form | 903 | 45 | 5.0% | 29 of 45 |
| B, new form | 897 | 72 | 8.0% | 46 of 72 |
The difference is 3 pp, with an interval (the difference ± 1.96 standard errors) of roughly +0.8 to +5.3 pp. The chi-squared calculator shows a significant difference, p around 0.01. About 64% replied to the manager in both groups, so the reply rate didn't drop, stayed above 55%, and the plan's guardrail condition is met. Following the plan, the centre keeps the new form.
In the report, write percentage points with the interval rather than "+60%". Sixty percent sounds more certain than the data allow: roughly speaking, they fit a lift of 15% as well as a doubling. A version for the owner: "The new form raised visitor-to-lead conversion from 5.0% to 8.0%, a difference of 0.8 to 5.3 pp. The test ran for six weeks on 1,800 visitors, with the promo applying to both groups."
The effect was measured under these conditions: on this page, with this traffic, in these weeks. On another page or in another season it may be different.
Sometimes there's no significant difference. That tells you one thing: the effect is smaller than the test could detect at its sample size, or there is none at all. Even a real effect of the planned size is missed by a test with 80% power one time in five. It's too early to call the forms equal. Decide on cost: you can keep the short form if it's easier for people and no worse on the guardrail metric, but don't promise a conversion lift in the report.
Exercise: is your test big enough to tell 5% from 8%
Your week 2 test in the Start track gave you clicks and leads. Work out what you can claim from them.
The calculator shows 894 visitors per variant, 1,788 for two. The IELTS prep centre had 171 clicks over the five days of its test, about 34 a day, and no more page visitors than clicks. Split 171 visitors between two forms, and each group gets about 85 people, a tenth of what's needed. At 34 clicks a day the calculator comes out at 53 days, and at the test's cost per click of 58 ₸, 1,788 clicks would cost about 103,000 ₸, ten times the whole test.
So nothing at all can be claimed from such a test about a 5% vs 8% difference. With 85 people per group, the test would catch at most a jump from 5% to about 15.5%: set the effect to 210% and the sample per variant drops to 84. Even the test's own conversion, 11 leads out of 171 clicks, or 6.4%, is known only roughly: with that few people it could be anywhere between 3.6% and 11%. And the three ads inside the test weren't compared by an A/B test at all: Meta decided who saw what and gave the ads different numbers of impressions.
The centre's paragraph came out like this: "To tell a 5% conversion from 8%, you need 894 visitors per variant, 1,788 in total. The test had 171 clicks across three ads, about 85 per variant if split in two. Nothing in this data shows that any ad or form converts better. Such a check would need about 100,000 ₸ of ads at the same cost per click, or several weeks of traffic to the whole page."
Video: the basics of A/B testing
The video explains how an A/B test works in advertising.