An IELTS prep centre in Almaty has finished its five-day Meta test: 9,860 ₸, 12,000 impressions, 11 leads, a CPL of 896 ₸ (the numbers in this lesson are illustrative). The media buyer is happy, since the plan was 2,000 ₸ per lead. The owner is looking at something else: the ad was shown 12,000 times, and three people came to the trial lesson. "Where are we losing people?"
CPL does not answer that question: it is one number for the whole path. A funnel does. It is the customer's path broken into stages, with the number of people who reached each one. Let's build it for this test, find the stage with the biggest drop and see what eleven leads can tell us about the cause.
Which stages make up the funnel
A funnel stage is a fact you can count and recount. For an ad test on leads, five are enough:
| Stage | Where the number comes from |
|---|---|
| Impressions | Ads Manager |
| Clicks | Ads Manager, link clicks |
| Leads | Your own lead list, without duplicates and tests |
| Leads with a valid phone number | The same list: you can message that number on WhatsApp |
| Qualified | The manager's notes after the chat |
Write down who counts as qualified in one sentence before you count, or the manager will decide by mood. For the centre, it is someone who replied on WhatsApp, is sitting the exam within the next six months and can attend at the centre's class times.
The first two rows count actions, not people: one person may have seen the ad three times and clicked twice. People start at the leads row. It does not get in the way of the test; just do not call CTR the share of people who were interested.
Count the funnel a couple of days after the test ends, not on the last day: someone who submitted the form on Friday may reply to the manager on Sunday. In product analytics this is called the conversion window. In Amplitude it defaults to one day in UTC, and the latest days on the chart are dotted until their window closes (how to read a funnel in Amplitude).
The week 2 test funnel
The first three numbers come from the week 2 test. The last two were added for this lesson: one lead has a wrong number, seven people replied on WhatsApp, and five of them fit the course.
| Stage | Count | Step conversion | Lost at this step |
|---|---|---|---|
| Impressions | 12,000 | - | - |
| Clicks | 171 | 1.4% | 11,829 |
| Leads | 11 | 6.4% | 160 |
| With a valid phone number | 10 | 91% | 1 |
| Qualified | 5 | 50% | 5 |
Step conversion is the share of people who reached a stage out of those who reached the previous one: 11 leads out of 171 clicks is 6.4%. Overall conversion is counted from the top of the funnel: 5 qualified out of 12,000 impressions is 0.04%. Put the denominator next to the percentage, or 50% of ten people and 50% of all traffic look the same.
In money, that is 9,860 ₸ for five qualified leads, 1,972 ₸ each. Three of them came to the trial lesson, so each person who came cost 3,287 ₸.
Where the biggest drop is
In percentage terms, the first step loses the most: 98.6% of impressions produced no click. But behind an impression is someone scrolling their feed, and comparing CTR with 100% makes no sense. You compare the top of the funnel with the plan or a previous test. The portfolio case records the plan for this test: 150 clicks and 5 leads. It got 171 and 11, with 6.4% from click to lead against 3.3% in the plan, so the top did better than expected.
Among people who had already left a number, the biggest drop is between a valid phone number and qualification: ten went in, five came out. That is the one to mark. Everyone lost here cost money: their lead cost 896 ₸ on average, and a person like that will not make it to the trial lesson.
Break those five down. Three did not reply on WhatsApp; two replied, but the course does not fit them. Split by ad, all four people who did not reply (counting the one with the wrong number) came from the "Problem" ad: it brought 7 leads and 3 replies, while everyone from the other two ads replied.
There is nothing to fix in a hurry, though. By the centre's calculation, about one lead in four makes it to the trial lesson, and a person who comes can cost up to 8,000 ₸. Here three out of eleven came, at 3,287 ₸ each. You mark the drop so you know where to look for headroom in the second test.
The cause is a hypothesis
The track step reads "find the drop and its cause", and it is tempting to write: "the ad about pauses in speaking brings people whose exam is far off". But behind that conclusion are seven leads from one ad and four from the other two. With numbers this small, the gap between 3 of 7 and 4 of 4 can easily come from chance, and eleven leads cannot tell you the cause. You can write down a hypothesis and how you will test it.
Rule out the boring explanations first; they take five minutes:
- How long did it take from the lead to the manager's first message? If it was a day, the person may have signed up with another centre already.
- Does the landing page match what the ad promised?
- Does the manager's first message follow on from what the ad promised?
- Does the form accept a mistyped number? If so, that is fixed on the site, not in the ads.
If all of that is fine, phrase the hypothesis about the ad so it can be tested: "The 'Problem' ad shows no price, so it draws people who are not yet thinking about a paid course. In the second test, on a bigger budget, we add the price to that ad, the manager records the time of the first message and the reason for each refusal, and we compare the reply rate by ad." Two weeks later you will have something to compare. "The ad is bad" does not give you even that.
Do not make an optional step mandatory
In an ad funnel the stages follow one another: there is no lead without a click. Inside a site or an app the path branches, and it is easy to write off people who simply took another route.
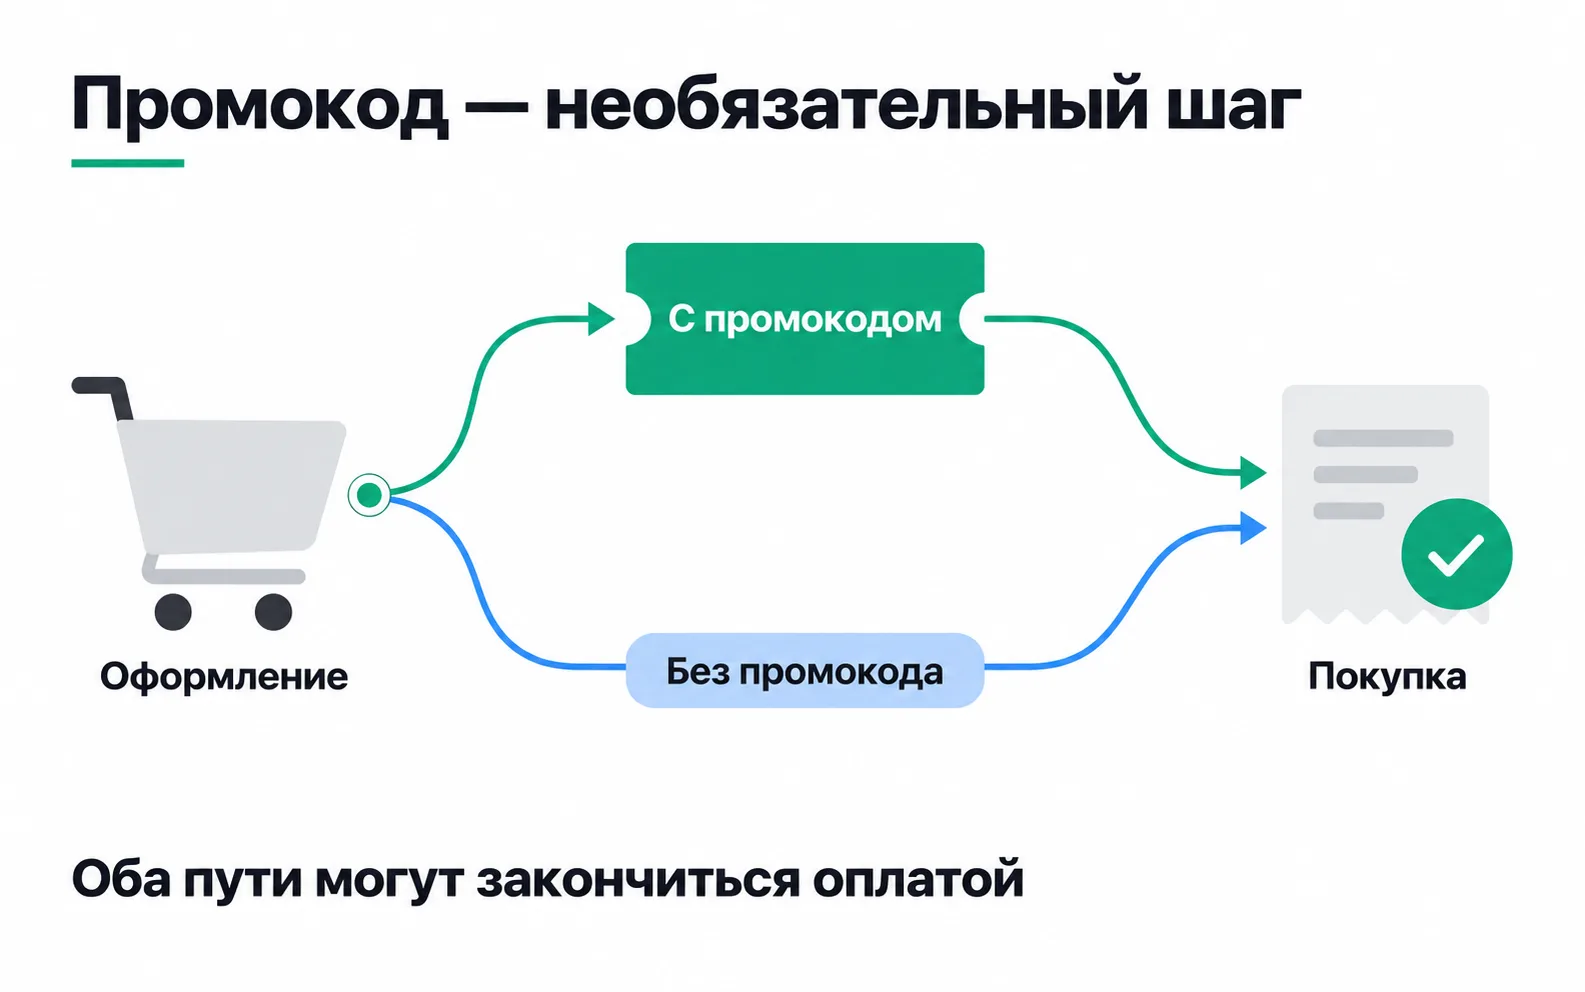
The picture shows checkout in an online store. Make "Applied a promo code" a mandatory step between checkout and purchase, and the funnel shows only the people who entered a code. Everyone who paid without one ends up among the lost. The arithmetic is right; the funnel is just answering a different question. Promo codes, newsletter sign-ups and viewing recommendations are analysed separately from the main path.
The same choice hides in your tool's settings. In Amplitude you set the order of steps in one of three ways (how to build a funnel). This order requires the steps in the set order and allows other events between them. Exact order allows no other events between the steps at all. Any order counts the steps in whatever sequence they happen. Someone who opened the delivery terms between checkout and payment reaches the purchase under This order and drops out of the funnel under Exact order.
A sharp drop at payment after a release
A funnel inside a product breaks differently. Yesterday a new release of the site or app went out, and today there is a sharp drop at the payment step. It is too early to change the ads: the traffic is the same as the day before yesterday, and what changed is what happens after the click. Taking payment out of the funnel to flatten the chart is no answer either: the signal goes away and the problem stays.
First separate lost data from lost money, and find out who is affected:
- Real payments. Compare payments in the payment system or CRM with
purchaseevents for the same days. If the payments are there and the events are not, tracking is broken, not payment. - Event collection. Go through a payment yourself with DebugView open: does
purchasego out, and with the same parameters as before? The release may have changed the confirmation page or removed the dataLayer push. - Devices and versions. Break the payment step down by device, browser and app version. If the drop is only in the new version or only on one platform, you have found the segment, and that is where you dig.
| What you found | What to check next |
|---|---|
| Payments exist in the payment system, events do not | How purchase is sent, the order number, delivery delay |
| A drop in one app version only | Errors in that version and its tracking |
| Payments fell everywhere, events match the payment system | The payment steps: payment form errors, new fields, support tickets |
| Some payments went through a manager | The link between the CRM order and the original lead |
A session recording shows what the person did on screen, but not why they left. Here too, an explanation stays a hypothesis until it has been tested.
Exercise: the funnel of your own test
This is a week 4 step of the Start track. Take the test you ran in week 2.
The step counts as done when all five stages have numbers and the biggest drop is marked with its cause. For the IELTS centre the note would read: "The biggest drop is from a valid phone number to qualified, from 10 to 5. All four people who did not reply came from the 'Problem' ad. Hypothesis: it shows no price, so it draws people who are not yet thinking about a paid course. Eleven leads neither confirm nor refute this; in the second test we add the price to the ad and record the time of the first message and the reason for each refusal."
If the biggest drop in your funnel came out as impression to click, compare the CTR with the plan or a previous test. If it is no worse, look for the drop further down. If you only have two or three leads, you can still count the stages, but the cause is guesswork: write down the hypothesis and collect more leads in the second test.
Video: an introduction to Funnel Analysis
An English-language video about product funnels. Before you build your own, write down the stages, who you count at each one and over what period.