Monday, 16 November, at an online booking service for beauty salons in Almaty: 12,000 ₸ a month after two free weeks. A new line has appeared in the weekly dashboard: retention of new salons in week 3 after sign-up. For the September salons it is 21.5%, for the October ones 13%. In October the marketer doubled the Instagram budget and got 320 new salons instead of 200, and wants to double it again in December. The founder writes in the team chat: "Instagram brought in salons that don't stay. No more doubling until we figure this out." The numbers in this lesson are made up.
What counts as coming back
Retention answers whether the value repeats. So a return is the value event, not just any action. For the booking service that is an online booking a client made herself: booking_created with source = online from the event plan. The first such booking is the salon's aha moment, and retention shows whether it happens again.
A login will not do. The receptionist opens the calendar every morning even if every client still messages on WhatsApp and she types the bookings in by hand. Logins show the service is being used as a notebook; they do not show whether it saves anyone time.
The period follows how often value happens: by day, small salons make the curve jump about; by month, it coincides with payment and arrives too late. The service counts by week: a salon is retained in week N if it got at least one online booking during days 7N to 7N + 6 after sign-up. Monthly retention by payments stays for a different question: has the product found its market.
A product rule also shapes the curve: after the two free weeks, online booking only works for salons that paid. From week 2 on, the curve shows salons that paid and keep getting bookings.
Week N: exactly that week, or that week and later
Retention in week N can be counted two ways, and in a tool it is easy to pick the one the service does not need. In Amplitude, Return On counts those who came back in exactly that period, while Return On or After counts that period or any later one (how Amplitude calculates retention). In Mixpanel the same options are called On and On or After (retention in Mixpanel). Mixpanel defaults to On or After, and Amplitude's help describes a Return On or After chart with any event as the return.
Take a salon that got bookings in week 0 and week 2, with the stylist on holiday in week 1. Counting "exactly that week", it lands in weeks 0 and 2; counting "that week or later", in all three. The second curve answers whether the salon stayed at all, the first whether it gets value every week, and the service needs the first.
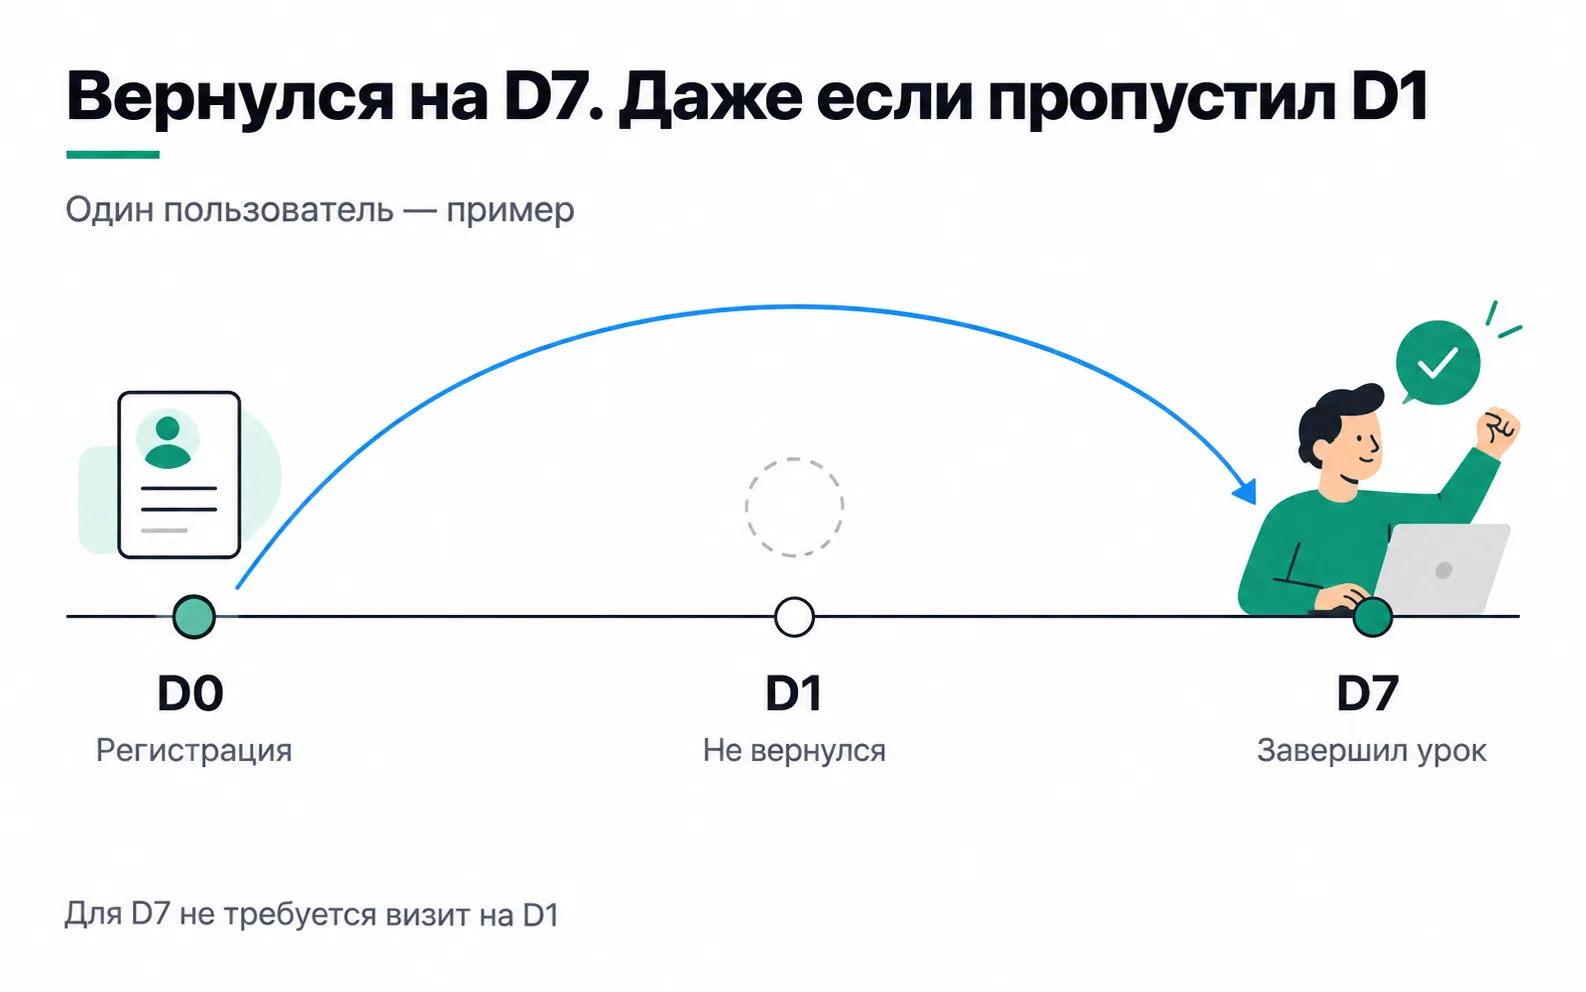
Retention is not a funnel: week 2 includes salons that were not in week 1. The picture shows the same for a learner on an online platform: they did not come back the day after signing up, but a week later they finished a lesson and counted towards day-seven retention.
Write down the day mode too: in Amplitude it is 24-hour windows from the starting event or calendar dates, in Mixpanel rolling or calendar, and you only reconcile the dashboard with the tool when the mode is the same.
The September cohort's curve
Here are the 200 salons that signed up in September. By 16 November, week 5 had passed for all of them.
| Week after sign-up | 0 | 1 | 2 | 3 | 4 | 5 |
|---|---|---|---|---|---|---|
| Got an online booking | 36 | 56 | 44 | 43 | 42 | 41 |
| Share of 200 | 18% | 28% | 22% | 21.5% | 21% | 20.5% |
In week 1 the curve goes up: some salons turn on booking later, and their first online bookings arrive in the second week. In week 2 it drops to 44: the trial is over, and booking stays on only for the 50 that paid. After that the curve is almost flat, losing a salon a week. Whether it levels off is decided on the monthly retention of paying salons; the weekly curve is valuable because it arrives sooner.
An immature cohort: weeks that have not happened yet
Now October. The dashboard query divides the number of salons that got an online booking in week 3 by all 320 October salons. But week 3 is days 21 to 27 after sign-up, and by Sunday 15 November it had ended only for salons that signed up between 1 and 19 October. There are 190 of them. For the other 130, week 3 is still running or has not started. It is running for the salons that signed up between 20 and 25 October, about 60 of them. Four of those have already had a booking, and the query counted the rest as not retained.
| September | October, as in the dashboard | October, only salons past week 3 | |
|---|---|---|---|
| Salons in the denominator | 200 | 320 | 190 |
| Got an online booking in week 3 | 43 | 42 | 38 |
| Week 3 retention | 21.5% | 13% | 20% |
In Amplitude and Mixpanel immature cells carry an asterisk, and Amplitude also removes from the denominator anyone who has not yet reached the period. A hand-written query does not, so the denominator includes only salons whose week N has fully passed, and next to the share you write what it was calculated from: "38 of 190". In a cohort table the same rule is put more briefly: "not yet" is not zero.
Sign-ups doubled: what to look at first
The fixed query ends the panic, but not the budget question. When sign-ups double and the new salons do not come back, you first break down early actions and retention by cohort and see whether the salons reach the value. Until you know, another doubling of ads brings twice as many salons into the same situation, and reporting sign-ups instead of retention only hides the problem.
October's early actions have already been broken down by channel: in no channel did the share of salons turning on online booking in the first week fall. And 20% against 21.5% in September is three salons out of 190, a gap that cannot be told apart from chance.
The answer to the founder: "For salons past week 3, retention is 20%; in September it was 21.5%. The 13% in the dashboard came from 130 salons whose week 3 has not ended yet; the query is fixed. Week 3 has not been broken down by channel yet, but we have known since September that salons from Instagram pay almost half as often as those from search. We'll decide on December by the cost per paying salon for October."
The aha moment and retention: each curve has its own denominator
The aha moment is the first online booking during the trial, and in the September cohort 60 of the 200 salons had it. The groups' retention is compared from week 2, after the trial has ended: otherwise a salon with its first booking in week 1 is retained by definition, and the curve compares the event with itself.
| Week after sign-up | 2 | 3 | 4 | 5 |
|---|---|---|---|---|
| With an aha moment, of 60 | 43 (72%) | 42 (70%) | 41 (68%) | 40 (67%) |
| Without an aha moment, of 140 | 1 (0.7%) | 1 (0.7%) | 1 (0.7%) | 1 (0.7%) |
Each row is divided by its own group. Divide the aha group's 40 salons by the whole cohort of 200 and you get 20%, no better than the overall curve: that happens when the retained salons are filtered by group but the denominator is left as the total.
The gap is huge, but most of it comes from payment itself: of the 140 salons without an aha moment, four paid, and for the rest online booking switched off after the trial. The curves say that salons which saw value during the trial keep getting it: two thirds of the aha group are still getting bookings in week 5. Whether nudging the rest would help, only a test on new salons can show.
Paying, but no bookings
Weekly retention runs ahead of payment. Of the 50 September salons that paid for the first month, 41 got online bookings in week 5 and 9 got none. Week 5 ends on day 41 after sign-up, and the second payment comes around day 44:
| Week 5 | Salons | Paid for the second month |
|---|---|---|
| Got online bookings | 41 | 40 |
| Got none | 9 | 3 |
| All salons that paid for the first month | 50 | 43 |
A salon that pays but gets no bookings is a churn that has not happened yet: of those nine, three paid for the second month. You cannot tell from the table why they stopped getting bookings, but a call list does not need the cause. Every Monday support gets a list of salons that pay and got no online bookings in the past week, and calls them before the next payment. Whether the calls helped will show in a comparison with a part of the list that nobody called.
Exercise: a retention curve for your product
Take a product people use repeatedly: a client's service, an app you work with, or the booking service from this lesson.
Now a situation. The marketer sends a chart from Amplitude: week 3 retention for the October salons is 46%. Your dashboard says 20%. Who got it wrong?
Most likely nobody: the charts answer different questions, and the answer is in the chart settings. Amplitude's help describes a retention chart with any event as the return and the Return On or After method: a receptionist's login counts the same as an online booking, and a salon with a booking in week 5 also lands in week 3. And Amplitude counts people, not salons. To make the charts comparable, set the return event to booking_created with source = online, the method to Return On, and the same day mode as in the dashboard, then reconcile what is left against the list of salons in the cohort.
Video: retention analysis in Amplitude
Day two of the intensive: retention in Amplitude. Note which counting method and which return event the presenter's chart uses.