The online booking service for beauty salons from the lesson on product-led growth is wrapping up October. In September, 40% of new salons turned on online booking within their first 7 days. In October, 37.5% did. The founder writes in the team chat: "What did we break in onboarding?", and the developers start combing through October's releases. Meanwhile the marketer's report for the same month has a line nobody connected to activation: the Instagram budget doubled. The numbers in this lesson are made up.
But before you hunt for a bug in the code, it pays to split the new salons into groups. Below we look at the kinds of groups there are, which cuts are useful, and how to tell a change in behaviour from a change in the mix.
Segment, cohort and behavioural cohort
People mix up these three words, and analytics tools blur them further.
| Group | Who it brings together | Example in the booking service |
|---|---|---|
| Cohort | Arrived in the same period | Salons that signed up in October |
| Segment | Share a trait at the moment they arrived | Salons that came from Instagram |
| Behavioural cohort | Did or did not do something | Salons that turned on online booking in their first week |
The lesson on cohorts and LTV shows how to build a cohort table and compare cohorts of the same age. Amplitude and Mixpanel call a behavioural cohort a cohort too, even though it has no arrival date. So when a colleague says "I looked at the cohort", ask which of the three.
Which cuts are useful
A cut earns its place when three things hold. The trait is known at the moment of arrival and does not change afterwards. Each segment holds enough salons that a single salon cannot move the rate by ten points. And someone on the team can act on the result: move budget, change onboarding, pick up the phone. For the booking service, these work:
| Cut | Where it comes from | What decision it informs |
|---|---|---|
| Sign-up channel | The initial_utm_source property, which both SDKs record | Where to move ad budget |
| City | city on the salon_signed_up event | Whether Astana needs its own support and its own ads |
| Device at sign-up | A custom property on salon_signed_up, such as signup_device | Whether salons need to be able to set up from a phone |
| Salon type | A custom property on salon_signed_up: hair salon, nail studio, barbershop | Which services to suggest by default |
Channel. Amplitude stores a person's first UTM parameters in initial_utm_source, initial_utm_campaign and the rest (UTM parameters in Browser SDK 2). Mixpanel writes the same properties to the profile, but only for an identified user and only the first time it sees their UTMs (UTM parameters in the Mixpanel JavaScript SDK). For salons that is no obstacle: signing up means logging in. Ad links still need tagging by the shared UTM scheme, or the cut will show three different names for one Instagram.
City comes from the sign-up form. Both tools work out their own city from the IP address: $city in Mixpanel (Mixpanel default properties), City in Amplitude (location in Amplitude). That city shows where the person connected from, not where the salon is. An owner whose salon is in Astana but who signed up while in Almaty lands in the wrong city.
Device and salon type are not yet in the event plan from the lesson on Amplitude and Mixpanel. Both properties are this lesson's own: they get added to salon_signed_up, and only salons that sign up after the release will have them. You cannot rebuild a segment after the fact, so any cut you will need in six months goes into the sign-up event now. Salon type plays the same role as the first purchase does in a shop: in the lesson on RFM analysis, a 60,000 ₸ grinder makes a one-off buyer look like a regular.
What not to cut by. For new salons the plan is an outcome, not a trait. At sign-up everyone is on the trial, and the plan becomes paid two weeks later for those who pay. Compare the first week of payers and the rest, and you are splitting salons by something that happens two weeks later. You will find differences in behaviour, but they tell you nothing about cause, just like the link between the aha moment and payment. Among established salons the plan is a perfectly good cut, as long as you take its value at the time of each event. That is exactly why plan goes on every event.
Size. With 200 new salons a month, two or three segments per cut are enough. In a segment of ten salons, each salon is worth 10 percentage points, and a difference of one salon cannot be told apart from chance.
In Amplitude you compare segments on one chart: in the Segmentation Module you add a segment with "+ Add Segment" or group the chart by a property. When you group, the chart shows the five segments with the highest values, and you can switch on the rest in the table below it (segments in Amplitude charts). In Mixpanel, Breakdown does the same by property or by cohort (Mixpanel reports).
Why the overall rate falls while every segment improves
Back to October, now with activation cut by channel. September's numbers are already familiar: 200 new salons, 120 of them from Instagram. In October the marketer doubled the Instagram budget, 1,920,000 ₸ instead of 960,000 ₸, and got twice as many sign-ups. Each cell shows the salons that turned on online booking within 7 days out of all that signed up through the channel:
| Channel | September | October |
|---|---|---|
| Instagram ads (Meta) | 36 of 120, 30% | 74 of 240, 31% |
| Google Search | 26 of 50, 52% | 27 of 50, 54% |
| Booking-page link and referrals | 18 of 30, 60% | 19 of 30, 63% |
| Total | 80 of 200, 40% | 120 of 320, 37.5% |
The rate did not fall in any channel. The overall rate fell because it is an average across channels weighted by the number of salons. In September 60% of new salons came from Instagram; in October, 75%. And from Instagram about one salon in three turns on booking, while from search it is one in two. The more Instagram salons in a cohort, the lower the overall rate, even if nothing changed inside any channel.
You can work out how much of this is mix. Take October's share of salons that turned on booking in each channel and multiply it by September's sign-ups. Of 120 Instagram salons, 37 would have turned on booking (half of 74 out of 240), 27 of the 50 from search, 19 of the 30 from referrals. That makes 83 of 200, or 41.5%. With September's mix, October would look no worse than September, and in fact a point and a half better.
Don't book that point and a half as a win either. In search and referrals it is one salon each, 27 instead of 26 and 19 instead of 18, and in Instagram it is two: at September's 30%, 72 of the 240 salons would have turned on booking, not 74. Swings like that happen without any change to the product. So the answer to the founder is more modest: October's data show no sign that the product got worse, and the overall rate fell because the mix of new salons changed. More salons have online booking than before, too: 120 against 80. Whether doubling Instagram paid off is decided on cost per paying salon, the way it was worked out for September, and that answer comes once October's salons finish their trial.
Mix can hide a problem as well. Say onboarding broke for salons from search, and search's share grew that same month: the overall rate could have stayed put, and nobody would have worried. That is why you keep at least one breakdown next to the overall number, by the cut where segments differ the most.
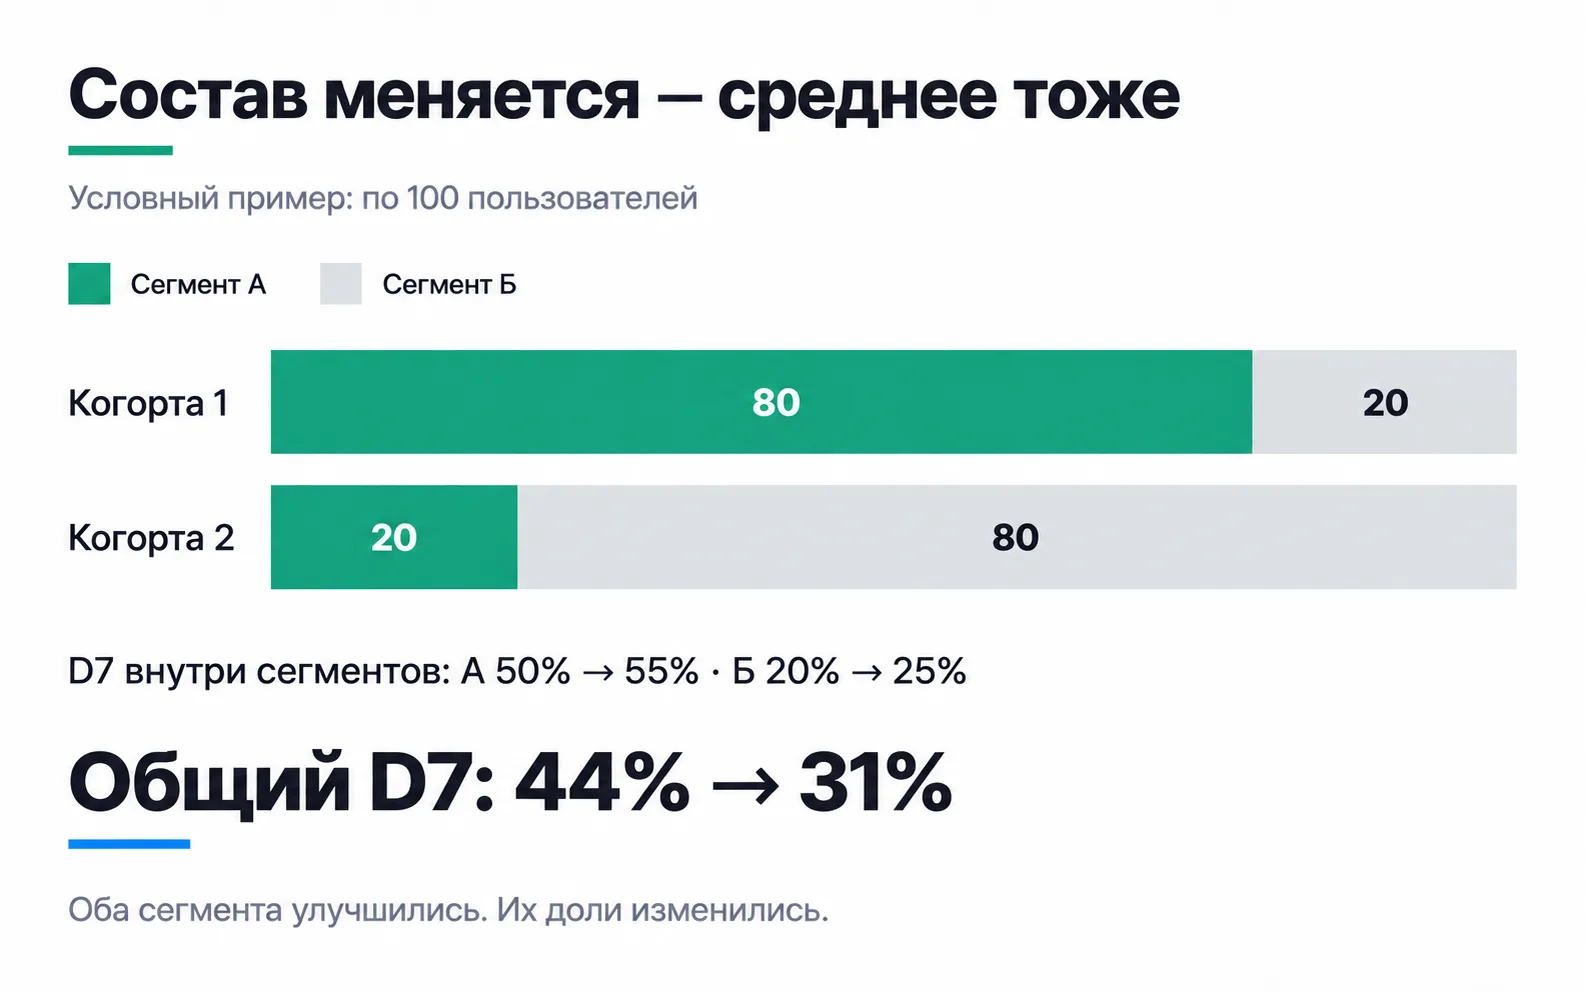
The picture shows the same effect at its most extreme. The segment shares swapped places, 80 and 20 became 20 and 80, and overall D7 (the share who came back on day seven) dropped 13 points even though it rose 5 in each segment.
Behavioural cohorts in Amplitude and Mixpanel
A behavioural cohort is a condition saved in the tool: who did or did not do something. The tool recalculates who meets it on its own. For the booking service the most useful cohort is "turned on online booking within 7 days of sign-up".
The Within window in Amplitude's cohort settings (how to define a cohort in Amplitude) is a poor fit for it. Within counts days from the person's first event in Amplitude, not from sign-up: if the owner browsed the website two weeks before signing up, her window closed before she ever created the salon. It is safer to save the activation cohort from a salon_signed_up → online_booking_enabled funnel with a 7-day window: click the booking step and create a cohort of those people in Microscope (Microscope in Amplitude). Then you pick the cohort in a chart's filter, and the funnel or retention chart covers only its members.
Three things to keep in mind with these cohorts.
Membership is recalculated. Amplitude does it every time it builds a chart (behavioural cohorts in Amplitude), and Mixpanel works out the members at query time (cohorts in Mixpanel). For a "first 7 days" condition that does no harm: a week after sign-up a person is either in the cohort or will never be. But a cohort of "took online bookings in the last 30 days" is slightly different every day. Comparing its size in June and in October means comparing different salons.
Not on every plan. Custom behavioural cohorts in Amplitude come with the Plus, Growth and Enterprise plans, not with the free one. In Mixpanel's free plan you can build a cohort but not save it.
A cohort holds people, not salons. If the owner signed the salon up and an administrator turned on booking, neither of them went through the whole funnel, and the salon never makes it into the cohort. Cohorts of salons in Amplitude need the Accounts add-on, and Mixpanel's Group Analytics counts funnels by salon (Group Analytics in Mixpanel). Both add-ons are paid.
A cohort is good for two things. The first is comparison: what share of salons that turned on booking in week one went on to pay, and how many bookings they take a month later. For September that comparison already exists: of the 50 salons that turned on booking in their first three days, 36 paid. That is an association, not a cause. Retention of such groups is compared without losing the denominators. The second is a list to act on. The reverse cohort, "signed up three days ago and haven't turned on booking", is the list of salons you message on WhatsApp on day three to offer setting up booking together.
Exercise: split a change into mix and behaviour
You need a metric that changed noticeably between two periods: activation rate, conversion to payment, average order value. Your client's product or shop will do, or, if you have no client yet, the booking service from this lesson.
A month later the same thing happened in reverse. In November the marketer brought the Instagram budget back to September's level. Instagram brought 120 salons, and 37 of them turned on booking in their first week; search gave 27 of 50 and referrals 19 of 30. The overall rate rose to 41.5%, and the marketer posts in the chat: "I cleaned up the audiences and activation went up." What do you reply?
Work out Instagram on its own: 37 of 120 is the same 31% as in October. Activation inside the channel did not move; the overall rate rose because Instagram's share of new salons went back from 75% to 60%. 41.5% is exactly the figure we got for October at September's mix. Cleaning up the audiences may have affected what matters more to the service, payments, but those show up only after the two free weeks. Your reply could be: "Instagram activation is the same, 31%; the overall number rose because the mix changed. Let's talk about audiences in mid-December, when November's Instagram salons reach payment."
Video: the basics of cohort analysis
An introduction to cohort analysis from Calltouch, in Russian.