In mid-October the owner of an online coffee shop in Almaty asks you for a loyalty programme like the ones cafés run: every sixth bag free. We will use the shop from the RFM analysis: freshly roasted beans delivered across Kazakhstan, an order of 15,000 ₸, of which the shop keeps 6,000 ₸. The numbers in this lesson are made up.
The sixth bag goes to buyers who reach six orders. But first the shop needs to understand why people stop after their first. So retention starts with a map: which stages a customer goes through, where they drop out, what to count at each stage and who owns it.
Where the shop loses customers
The shop has 2,400 customers a year. 1,560 of them ordered once, and the other 840 placed 5,640 of the 7,200 orders, as the shop's marketing chain shows. Each of those 840 averages almost seven orders a year (5,640 / 840 ≈ 6.7). Each of the 1,560 left one order and 6,000 ₸.
The line between the two groups is the second order. Over the summer roughly a quarter of new customers placed one within 60 days, and the owner wants a third by the end of the year. A "sixth bag free" programme kicks in at the sixth order, while three newcomers out of four made no second order within 60 days. The gifts would go mostly to the 300 regulars, who will order without them anyway.
So for this shop, retention architecture is first of all a newcomer's path to the second order. After that, regulars order at their own pace and the job changes: stay out of their way and notice in time when someone disappears.
The main metric: a second order within 60 days
Write the metric down so that the owner and the marketer count it the same way:
- New customer: a CRM contact whose first paid order fell in this month. Merge duplicates before counting, or a second order from another phone number looks like a new person's first order.
- Second order: the next order with the "paid" status. Cancelled and refunded orders don't count.
- Window: 60 days from the first paid order.
- Cohort: all new customers from one month. The share is taken over the whole cohort.
The shop chose a 60-day window around its buying rhythm. In the RFM analysis of 840 repeat buyers, the median of their individual average gaps between orders is 28 days. Two such gaps give a starting point, but before choosing a window, look at the distribution too: how many people come back much later. Here, no order within 60 days only means that the chosen window was missed.
The July cohort shows it in numbers. 150 people placed a first order in July. To give everyone a full 60 days, a monthly cohort closes 60 days after the month's last day; for July that is 29 September. 38 placed a second order within their own window: 21 in the first 30 days and another 17 between day 31 and day 60. Retention over 60 days is about 25%. Over 30 days it would be 14%, excluding those 17 later returns.
| Cohort | New customers | Second order within 60 days | Window closed |
|---|---|---|---|
| June | 140 | 35 (25%) | 29 August |
| July | 150 | 38 (about 25%) | 29 September |
| August | - | - | 30 October |
| September | - | - | 29 November |
In mid-October it is too early to compare the August cohort with a mature one. Some customers haven't reached day 60 yet, so the share may grow until 30 October. Mark an immature cohort separately and leave it out of comparisons of final rates for now.
This also tells you when to assess the "a third by year-end" goal. For December's cohort you need to wait 60 days after the last first purchase made in December. The last fully mature monthly cohort on 31 December is October's: its window closes on 30 December. At New Year, assess the goal on the September and October cohorts.
Off-the-shelf reports calculate retention by their own rules. Amplitude, for example, distinguishes Return On from Return On or After: a return on exactly the given day versus a return on that day or later. The shop has its own rule, at least one further paid and non-refunded order within 60 days of the first payment, and a figure from someone else's dashboard is compared with it only if the rule is the same.
Five stages, each with its own owner
The second order is the result of several steps, and the marketer doesn't own all of them. They can send a reminder, but they can't speed up the courier or change the roasting schedule. So every stage on the map has a person who answers for it.
| Stage | What the customer is doing | What the shop does | What to count | Owner |
|---|---|---|---|---|
| Order and delivery | Waits 2-5 days for the parcel | Ships beans roasted this week | Days in transit; the roast date on a test order once a month | Owner and the courier company |
| First week | Brews the first cups | Two days after delivery, sends a grind guide for their brewing method | Grind questions and taste complaints per 100 first orders | Roaster and manager |
| Weeks three and four | The bag may be running low | A postcard with an estimated date the beans will run out; 21 days after delivery, a WhatsApp reminder or an email for those who agreed to messages | Share of the cohort with a second order within 60 days | Marketer |
| After the second order | Orders at their own pace | Shows new lots to them first, no discounts | Share of customers whose last order is no older than 30 days | Marketer |
| Pause | Has stopped ordering | The owner writes personally and asks why | Reason for the pause on the CRM card | Owner |
The reminder timing follows one bean-use scenario. At two cups a day of 16 g each, a kilogram lasts about a month (1,000 / 32 ≈ 31 days): 21 days after delivery there are still beans left, and a new bag has time to arrive in 2-5 days.
The order of the stages matters. If the first bag came out bitter because the customer ground it wrong for their cezve, a reminder three weeks later will remind them of bitter coffee. And in September the manager was asked 14 times which grind suits a cezve: the shop built its Instagram series out of questions like that. It looks like people already stumble at the second stage, and it needs fixing before the third.
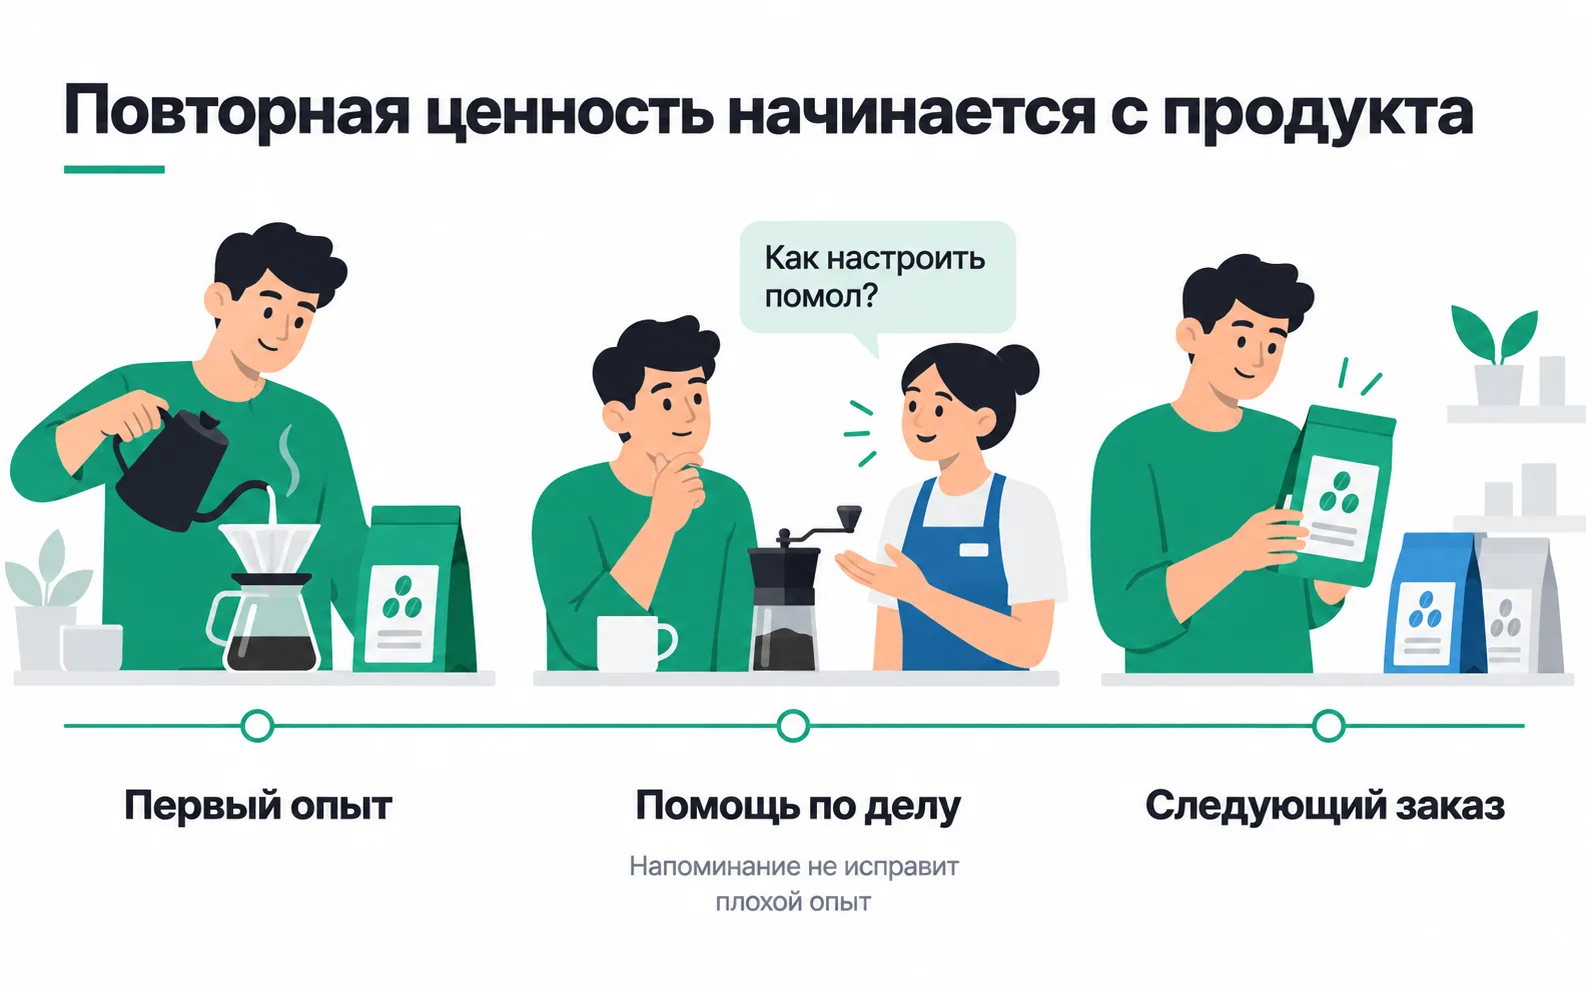
The third stage is still almost empty. Instagram guides tagged utm_campaign=reorder are already going out, the postcard hasn't been printed yet, and the shop is only now building the reminder as a trigger flow.
What data the system needs
Five fields on the customer card cover all five stages, and without any one of them the system makes mistakes:
- Customer ID, duplicates merged.
- Paid orders with payment and delivery dates: they set the 60-day window and the reminder day.
- Brewing method from the "How do you make your coffee?" field on the order form: cezve, pour-over, espresso machine or moka pot. Without it, the guide is a guess.
- Consent to messages for each channel, with the date and the wording of the checkbox. The checkbox on the form is not ticked by default.
- Open questions and complaints. While a complaint is open, the person gets no reminders to order.
Before every send the system checks the card again. If the person placed a second order yesterday, opened a complaint or unsubscribed, the reminder is cancelled. Otherwise someone who has just ordered gets "Your beans are running out".
Consent to reminders is collected separately from the phone number for the courier. The WhatsApp Business Policy allows messages only to people who gave their number and confirmed they want them, and requires every request to stop to be honoured. It is safer to treat a phone number as personal data. On our reading of the Law on Personal Data and Their Protection (as amended up to 14 September 2026), advertising goes beyond the processing purpose if consent named delivery only (Art. 14), and it is the shop, as the data operator, that has to prove consent was given (Art. 25(2)(5)). So the date and wording of consent are kept on the customer card. This is not legal advice.
How to tell the system is working
Once a month the owner gets one table: closed cohorts by month of first order, each with the number of newcomers and the share with a second order within 60 days. Under it, one row per stage: average days in transit, grind questions per 100 first orders, and the share of newcomers who agreed to reminders. That last row shows how many people the third stage can reach at all: about 100 of the 150 newcomers a month agree to WhatsApp or email messages, and the reminder does not reach the other 50.
Email opens, followers and loyalty point balances are not in this table. An opened email is not an order yet, an Instagram follower may never buy, and points show how much the shop owes its customers rather than how many came back.
If the share rises from a quarter to a third, the overall increase cannot separate each step's contribution: the postcard, the reminder and the guides all run at the same time. How much each one adds only shows up against a group that didn't get that step, as in retention experiments.
Exercise: a retention map for your own business
Take a business with repeat purchases: yours, a client's or a friend's. You'll need an export of paid orders for the year with customer ID and date.
Every business has its own window. For example, with a 45-day median, a 90-day window is a possible two-gap starting point; then look at how many later purchases it excludes. For infrequent purchases such as furniture, a short window is of little use. Referrals and reviews can be counted separately under their own metric names.
The last item is easy to get wrong. The stage where most people leave and the stage that needs fixing may not be the same one: the shop loses people between the first and second order, while grind questions point to a possible earlier obstacle. Conversations with buyers can establish whether it gets in the way of returning. Repeated questions give the team a reason to improve the guide.
Put a person's name in the "owner" column. If it says "marketing" or "everyone", nobody owns the stage. The marketer can't shorten delivery times, but can bring the owner the days in transit from their table once a month, and then at least the stage is visible.