The owner of an online coffee shop in Almaty, the same one as in the lesson on Conversions API, exports everyone who bought in the past year from the CRM: 2,400 people. The plan is simple: send them all a 15% promo code with the line "We haven't seen you in a while". But the list includes people who buy beans every month and will order next week with no promo code at all. It includes people who once bought drip bags as a gift and may have no use for beans. And it includes eighty people who ordered regularly for months and then vanished. A promo code won't tell you why they left, and they are the shop's most expensive losses. The shop and the numbers in this lesson are made up.
RFM analysis splits a customer base into groups like these using three numbers from the order history. Below we calculate them from a CRM export, split the customers into segments and decide what to do with each.
Three numbers for every customer
R (recency) is the number of days from a customer's last paid order to the calculation date. F (frequency) is how many paid orders they placed in the period, and M (monetary) is how much those orders came to.
Recency is the one that matters most. IBM calls it outright the most important factor when you need to predict who will respond to a new offer. Frequency and money describe what kind of customer someone used to be.
Two of the shop's customers show why the total alone is not enough. Both arrived in the summer, so their whole history fits into 90 days. Aliya ordered a kilogram of beans with a box of drip bags three times, 20,000 ₸ each, the last time five days ago. Bek bought a grinder with a kilogram of beans once, for 60,000 ₸, 50 days ago.
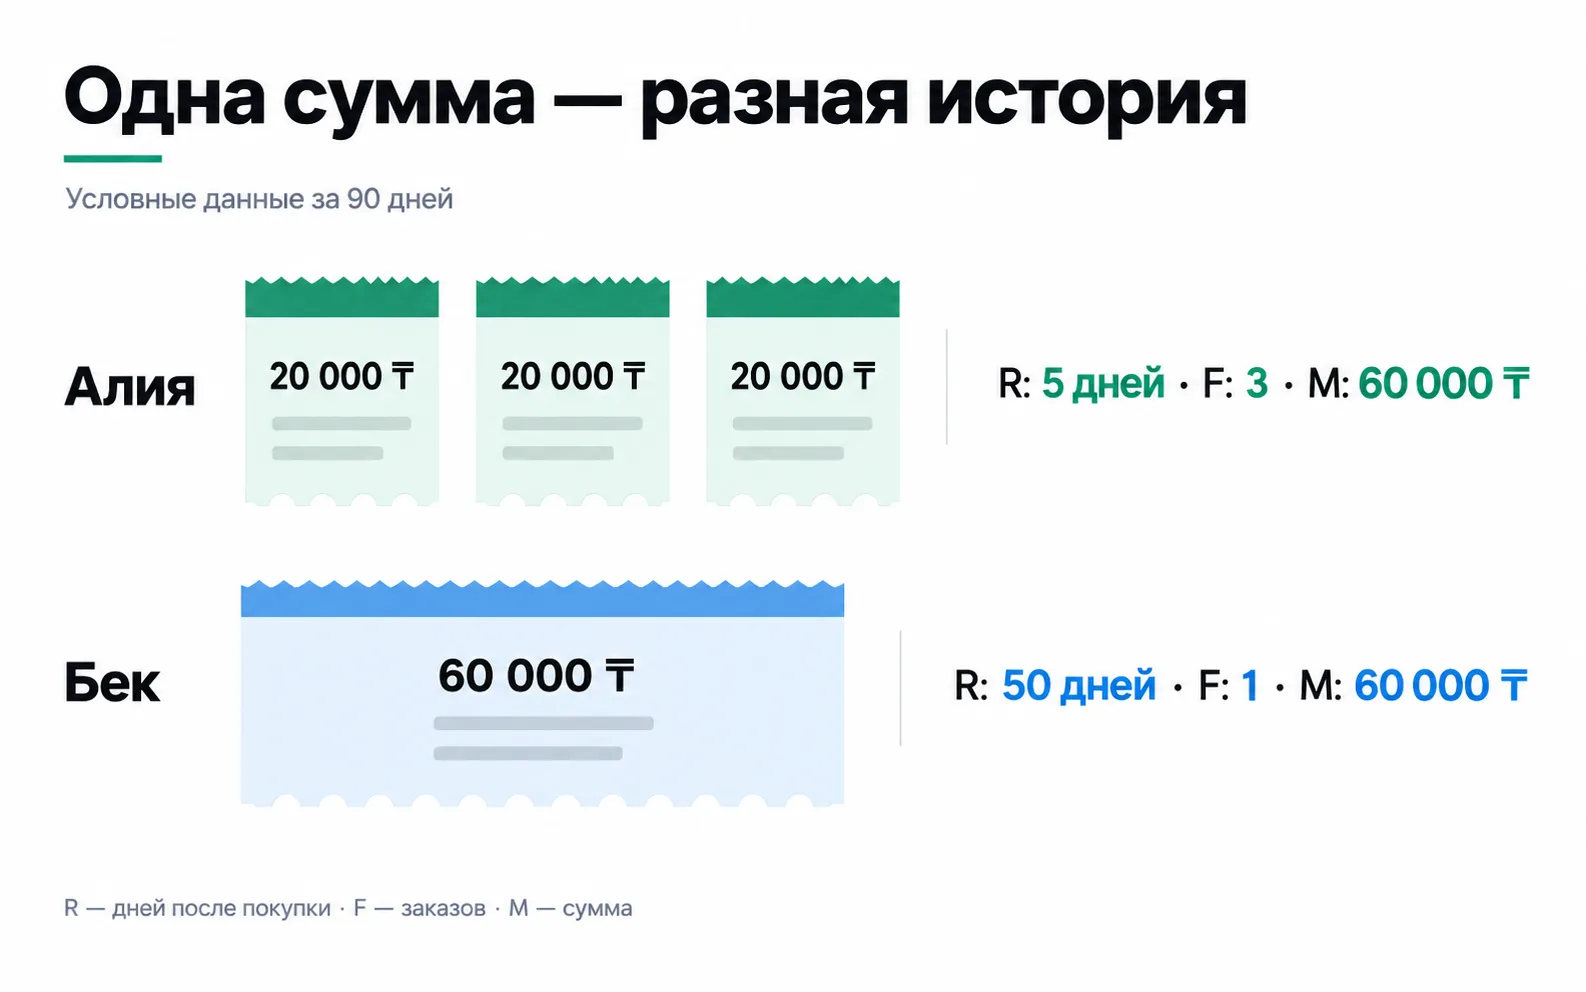
By total they are identical. By history, Aliya orders every month, while Bek made one big purchase, and three quarters of it is a grinder nobody buys twice. Sort the base by M and Bek sits next to Aliya, even though his next order, if there is one, will be a kilogram of beans, a quarter of what he paid for the grinder with beans.
The CRM export: what counts as an order and a customer
Write the rules down before you calculate. Without them, two runs on the same base produce different segments and you won't know why.
- The calculation date is the same for everyone: 1 October 2026. R is counted from it, not from the day you happened to open the spreadsheet.
- An order is one that reached the "paid" status in the CRM, just as for sending purchases to Meta. Cancelled and refunded orders don't count.
- A customer is a contact in the CRM, not a phone number on an order. If someone ordered from two numbers, the CRM may have created two contacts for them, and their orders will be split between the two. Merge duplicates before you calculate, keeping in mind how contacts and deals work in a CRM.
- The window. R comes from the last order, F and M from the last 12 months.
A 90-day window looks tidier, but it hides the very people you need most. From January to July, Damir ordered a kilogram of Ethiopian beans for 15,000 ₸ roughly every 30 days, the last time on 15 July. Over 12 months he has F = 7 and M = 105,000 ₸. A 90-day window, 3 July to 1 October, catches only the July order: F = 1, M = 15,000 ₸, and Damir looks like someone who tried once and left.
You can calculate the three numbers in Google Sheets. Export the paid orders for the year: customer ID, order number, date, amount. Create a pivot table via Insert → Pivot table, put customer ID in rows and the date, order number and amount in values (how to create a pivot table). For the date, choose MAX under "Summarize by", which gives the last order, then add the date a second time with MIN, which gives the first. Use COUNTA for the order number and SUM for the amount (which functions a pivot table offers). In the next column, calculate R: the calculation date minus the date of the last order.
The shop ends up with 2,400 customers, 7,200 paid orders and 108,000,000 ₸ for the year, 15,000 ₸ per order on average.
Scores: thresholds set by the buying rhythm
R = 5 days is a value. An R score of 3 is a position on a scale where customers who bought recently get more points. They are different things and live in separate columns.
The classic scheme splits each number into several groups and glues the scores into a code: with five groups the best code is 555 and there are 125 combinations. For a shop with 2,400 customers that is about 19 people per combination, and nobody is going to write 125 different messages. Five equal groups by F don't work either: 1,560 of the 2,400 customers have exactly one order. That is 3.25 groups of 480, so the first three groups and a quarter of the fourth are all customers with F = 1, and scores 1, 2, 3 and some of the 4s mean the same thing.
So the thresholds follow the shop's own rhythm. A customer's average interval comes from the same pivot table: last order date minus first order date, divided by F - 1. Among the 840 customers who ordered more than once, the median of that interval is 28 days. That gives the scale:
| Score | R: days since last order | F: orders in 12 months |
|---|---|---|
| 3 | up to 30 | 4 or more |
| 2 | 31-60 | 2-3 |
| 1 | over 60 | 1 |
R up to 30 days means the customer is in their usual rhythm. 31-60 means they skipped one order. Over 60 means they skipped two or more. Four orders at the shop's usual pace means at least three months in a row.
The "over 60 days" threshold is the same for everyone, but customers keep different rhythms. It is more precise to compare R with the customer's personal interval, the same one used to set the thresholds. For Damir, 14 January to 15 July is 182 days across six intervals, about 30 days each. On 1 October Damir's R is 78: for him that means two missed orders. A customer who buys beans every two months is just running a little late at the same 78 days.
In this scheme M sorts customers within a segment and tells you whom to contact first among those who have gone quiet. The shop gives money no separate score, because a typical order is a kilogram of beans for about 15,000 ₸, so the amount almost mirrors frequency. Where M and F diverge, as with Bek, it is a reason to look at what the person bought.
Five segments and what to do with each
| Segment | Rule | Customers | What to do |
|---|---|---|---|
| Regulars | R 3, F 2 or 3 | 300 | No discounts. Show them new bean lots first |
| Newcomers | R 3, F 1 | 220 | Three to four weeks after the order, remind them the beans are running out |
| Due a reminder | R 2, any F | 320 | One message about the beans they bought last time |
| Valuable but slipping | R 1, F 3 | 80 | Find out why they stopped ordering |
| Lapsed | R 1, F 1 or 2 | 1,480 | An occasional mailing about new lots, or nothing |
Your base will have its own segment sizes: they depend on what the business sells and how long it has been running.
Aliya, with R of 5 days and three orders, is a regular. Regulars get no discount. They will order anyway, and a promo code only cuts revenue from orders that would have happened without it. Bek, at R of 50 days, is due a reminder. The kilogram of beans that came with his grinder may well be finished, so a message about beans makes sense. Treating him as a 60,000 ₸ customer does not.
Timing matters for newcomers. The median interval is 28 days, so the time to write is in the third or fourth week after the first order, when the bag is running low, not the day after delivery.
Valuable but slipping
This is Damir's segment: 80 customers, each with at least four orders in the year and none in the last 60 days. Over the year they placed 520 orders worth 7,800,000 ₸. That is 3% of customers and 7% of the shop's revenue.
Here is how to read the three numbers. F and M are the past: Damir ordered every month for half a year and brought in 105,000 ₸. R is the present: he hasn't ordered since July. Together they are a reason to find out why he stopped. A welcome message for newcomers doesn't fit him; he is a long-standing customer. A discount for the whole base misses too: it goes to people who would have bought anyway and never reveals why he paused.
How to work through the segment:
- Sort the 80 customers by M and start with those who brought in the most.
- Open each one's last order in the CRM: status, delivery, complaints, what was in the order.
- Group what you find. For the shop it came out like this: for 18 customers, Damir among them, the lot they used to buy had run out; 10 have a complaint about late delivery on their card; for 52 the CRM holds no reason, because nobody asked them.
- Write to each of them personally, in the owner's name, not as a mass mailing. To Damir: "A new Ethiopian lot arrived in September, from a different farm. Shall we set a kilogram aside for you?" Those who complained get an apology first and a question about whether delivery is fine now. The other 52 get a question about what went wrong.
- Record the answers as a reason from a fixed list, like rejection reasons in the CRM. In a couple of months you will see where the shop loses its regulars: range, delivery or price.
Eighty people are too few to measure how many customers the messages won back. Put half in a control group and you have 40 in each, where a difference of two or three returning customers can easily be chance. With a segment this small, the value of the work is in the reasons, not in a return rate. Once the segment grows to hundreds, you leave part of it without messages and compare, as in an A/B test.
What RFM won't tell you
- The reason for a pause. R shows that a customer stopped ordering; why is found in the orders and in conversation.
- Profit. M is revenue. Bek's grinder and Aliya's beans can earn the shop different margins on the same 60,000 ₸. If a decision depends on profit, use contribution instead of revenue, as in unit economics.
- How newcomers will turn out. A customer who arrived two weeks ago cannot have F above one or two, which is why newcomers get their own segment rather than being compared with regulars.
- What changed after the calculation. RFM is a snapshot on a date. Recalculate segments monthly, and before sending anything remove those who ordered after the calculation date or unsubscribed from messages.
If you sell something people buy once every few years, furniture for example, almost everyone will have F of one and RFM will tell you little. A subscription where everyone pays the same amount every month gives RFM little to tell apart as well: there you look at how long customers from different months stay (cohorts and LTV) and where they came from (segmentation by channel).
Exercise: RFM on your own base
You need an order export from a business with repeat purchases: your client's shop, a delivery service, a salon. If you have no client yet, ask an owner you know for an export without names or phone numbers, with customer IDs only.
If the valuable but slipping segment comes out empty, check whether it fits in the window: four orders and two missed ones make five intervals. With a median of 90 days that is more than a year, and no such customer can appear in 12 months. Then you lower the F threshold to three orders or take an 18-24 month window. If the regulars come out empty too, the business probably sells something people don't buy again, and RFM isn't the right tool. And if the segment holds hundreds of people, start with the top twenty by M: you will learn the reasons faster from them than from a mailing to everyone at once.
You are done when you have a segment table with the number of customers in each, and a list of the valuable but slipping with one line per person: what was in their last order and what you will write to them.