The Monday meeting at an online booking service for beauty salons in Almaty. The marketer shows 320 sign-ups in October against 200 in September, the product manager the share of salons that turned on online booking, the accountant 1,200 active salons at 12,000 ₸ a month. Every number is correct, and each one pulls the team its own way: the marketer wants to double Instagram again, the product manager wants to rebuild the setup flow. The founder asks for one number that shows the service is bringing salons more and more value, and that tells everyone how they can move it. The numbers in this lesson are made up.
What a North Star Metric is
Amplitude defines the North Star Metric as the single metric that best captures the value customers get from the product. It has three properties: it reflects the value users get, product and marketing can influence it, and it leads revenue (a good versus a bad North Star). The same article explains why monthly recurring revenue (MRR) and average revenue per user (ARPU) do not fit the role: they describe the past. Nor does the number of registered users, because it says nothing about what those people do in the product. The full approach, including a workshop for the team, is collected in the North Star Playbook and the materials around it.
A North Star is a team agreement, not a law. Whether its growth will pull payments along is something you check on your own data, and the booking service already has that check: salons that get online bookings keep paying.
Candidates for the booking service
| Candidate | What it shows | Does it fit |
|---|---|---|
| Sign-ups per month | How many salons ads and referrals brought in | No: it grows with the budget, 320 instead of 200 in October, and says nothing about value |
| Active salons | How many salons paid for the month | No: this is revenue, 1,200 × 12,000 ₸, and it lags by a month |
| Logins per week | How often staff open the service | No: logins do not show whether the service helped |
| Online bookings per week | How many times clients booked themselves, without the receptionist | Yes: it is the salon's value, both product and marketing affect it, and it comes before payment |
An online booking is what the salon pays for: the receptionist does not have to answer Instagram messages at midnight, and the client does not have to wait until morning for a reply. Everyone can move it. Marketing brings in salons that need it, product helps them turn it on sooner, support brings back the ones whose bookings have stopped. And it runs several weeks ahead of payment.
Ideally you would count visits: the client booked and came. But salons mark no-shows in the calendar by hand, and not all of them do, so a visit is not visible in the data everywhere. That is why the metric counts online bookings created, and no-shows sit next to it as a guardrail.
A one-line definition
The North Star goes into the metrics glossary the same way the active salon for the investor report did:
Online bookings per week: bookings that clients made themselves through the salon's link (
booking_createdwithsource=online), Monday to Sunday, Almaty time, across all salons on the trial and on a paid plan. One client at one time is one booking, however many services she picked. Bookings that salon staff made through the link themselves while logged in, and the team's test salons, are not counted. Source: the service's database. The analyst changes the definition, and only together with the founder.
In the week of 9 to 15 November there were 24,000 of them.
Before you sign off on the definition, try to grow the metric without adding value. If every service counted as a separate booking, a manicure plus a pedicure would give two bookings instead of one, and the metric would rise because the form gained an "Add a service" button. If bookings the receptionist made through the link herself while testing it counted, the metric would rise from tests. Each loophole is closed by a line in the definition, not by an agreement that "we won't do that".
What it is made of
A single number does not tell anyone what to do, so the North Star is broken down into input metrics, and each one has an owner. Amplitude recommends three to five of them and suggests looking for them along four lines: breadth, depth, frequency and efficiency (how to find your North Star). Three are enough for the booking service:
Online bookings per week = salons that got at least one online booking that week × online bookings per such salon.
In the week of 9 to 15 November that is 960 × 25 = 24,000.
| Input metric | Now | Who moves it |
|---|---|---|
| New salons with a first online booking during the trial | 60 of 200 in September | Marketing and onboarding |
| Salons that got at least one online booking that week | 960 | Product and support |
| Online bookings per such salon per week | 25 | Product: a link in the Instagram profile, reminders to clients |
The first row feeds the second: salons that reach the aha moment today will be getting bookings as paying salons a month from now. The second row is breadth, the third is depth. When the North Star grows, the breakdown shows where from: more salons, or the same salons getting more bookings. This is arithmetic, and it will not name the cause of growth, but it will tell you whom to ask.
Guardrails
The North Star can be grown in a way that leaves value flat or even lowers it. So guardrail metrics sit next to it, the same kind as in a feature A/B test, only permanently. At the booking service the guardrails watch three things: quality, retention and complaints:
- quality: no-shows per 100 online bookings in salons that mark them, currently 8;
- retention: the share of paying salons that got an online booking that week, and payment for the next month;
- complaints: support requests per 100 salons per week.
A learning service whose North Star is "useful exercises completed" has the same three guardrails: quality of completion, learner retention and complaints, while a delivery service also puts contribution per order next to its North Star. Clicks on the "Next" button will not show how well people learn: they are easy to rack up without learning anything.
And no North Star replaces the other metrics. Revenue, acquisition cost and salon payback stay in the founder's report: the North Star says whether value is growing, and money is counted separately.
How the North Star grows without value
Suppose the test of the "Free slots" button, which sends clients the open times for tomorrow, ended like this. The button was shown to a random half of the active salons, by a flag on the salon ID: 600 of the 1,200, and the other 600 did not see it. Figures for the third week of the test:
| A: no button | B: with the button | |
|---|---|---|
| Salons | 600 | 600 |
| Online bookings per week | 12,000 | 12,960 |
| No-shows per 100 online bookings | 8 | 15 |
| Took place, estimate | 11,040 | 11,016 |
| Support requests per 100 salons | 4 | 9 |
In group B the North Star is 8% higher. Bookings that took place are the same, in group B even 24 fewer, or 0.2%, and on these data you cannot say the button added even one booking that took place. Meanwhile no-shows went up to 15 per 100 bookings from 8, and support requests more than doubled. No-shows were counted in the salons that mark them and applied to all of the group's bookings, so "took place" is an estimate. Looking at the North Star alone, the team would have shipped the button to everyone and reported growth.
Why clients fail to show up more often is something you find out by talking to receptionists. One hypothesis is that they book tomorrow's slot straight from the message without checking their plans. And the decision follows the rule written down before the test: a guardrail got worse, so the button does not ship in this form.
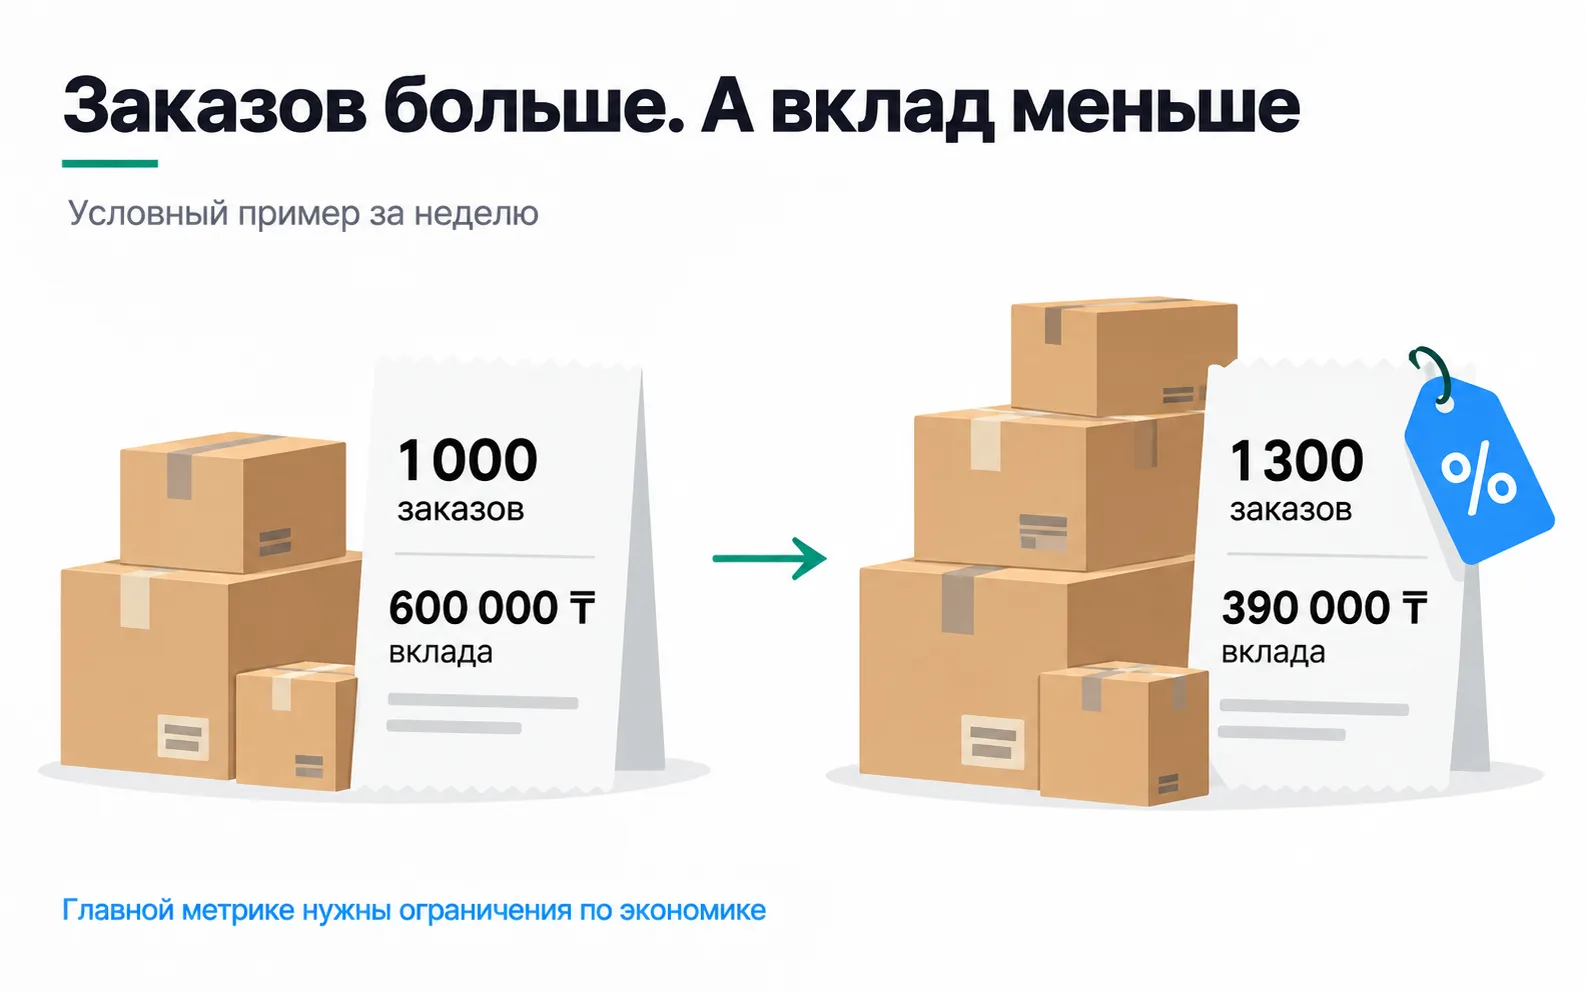
The picture shows a similar gap at a delivery service: more orders, less contribution.
Where the North Star lives
In the weekly dashboard the North Star is the top line, with the three inputs under it and the guardrails beside it. If the definition changes, the date is marked on the chart. The metric itself is revisited when the product changes. If every salon starts marking no-shows, visits will show up in the data, and the better North Star will be online bookings where the client actually came. The prepayment test shows why: online bookings went down in it, while visits stayed almost the same.
Exercise: the North Star for your product
Take a product you work with, or the booking service from this lesson.
Now a situation. The founder proposes making revenue the North Star: "Money is the value, why count anything else?" What do you say?
Revenue stays in the report, but it should not be the North Star: it is the last to find out about churn. In the September cohort, nine salons paid for the first month but got no online bookings in week 5, and only three of them paid for the second month. Online bookings showed the problem before the payment, while the salon could still be called; revenue showed it on the day six salons did not pay. Besides, product and marketing affect revenue a month later, after the trial and payment, but online bookings from the first week. Your answer to the founder could be: "We'll keep revenue in the weekly report. Let's make online bookings the North Star: they move before the money does, and every team can see its own contribution in them."
Video: choosing a North Star Metric
An introductory video on choosing a main metric. As you watch, try its criteria on the booking service's online bookings or on your own candidate.