The second week of November at an online booking service for beauty salons in Almaty. A salon pays 12,000 ₸ a month after two free weeks; about 1,200 salons pay for it and about 200 new ones sign up each month. By Monday lunchtime the analyst has five messages in the team chat: from the founder, the marketer, the accountant, and two from the product manager. Nobody writes "work out the conversion rate". Each of them has a decision to make and wants a number they can rely on. The numbers in this lesson are made up.
Who comes with questions
Here are those five messages, one row each:
| Who asked | Question | What the answer decides | What it turned into |
|---|---|---|---|
| Founder | "In October 37.5% of new salons turned on online booking, in September 40%. What did we break?" | Whether to hunt for a bug in the October releases | A breakdown by channel and a new row on the weekly dashboard |
| Marketer | "We doubled the Instagram budget in October and put it back in November. Do we double it again in December?" | The ad budget for December | A "cost per paying salon" metric by channel |
| Product manager | "Do we release the free-slots button to everyone at once?" | Whether to show the button to 1,200 salons | An A/B test plan |
| Product manager | "Since the iPhone app update, analytics shows fewer confirmed logins. Shall we simplify the code entry screen?" | Whether to redesign the screen | A reconciliation against the server log |
| Accountant | "How many active salons do we have? I need it for the investor report" | A number in the report | A metric definition and a single number |
Each of them works on a different horizon: the founder thinks in months and money, the marketer about the budget, the product manager about the next release, the accountant about the report deadline. The data is shared: events from the app and the website, the service's database and spend from the ad accounts. The analyst answers each in their own units: the marketer in tenge per paying salon, the product manager in shares of salons, the accountant in one number with a definition.
There is scheduled work too: on Mondays the team goes through the weekly dashboard, before a release the analyst goes over the service's event plan with the developers, after the release checks that the events arrived, and plans tests together with the product manager.
How a request becomes a metric, a dashboard or a test
Before opening the database, the analyst asks whoever sent the request four questions:
- What will you decide when you have the number? If nothing, the request can wait until there is a decision.
- How often do you need this answer? Once, and a number in the chat will do. Every week, and it needs a dashboard.
- Are you asking what happened, or what will happen if something changes? Past data cannot answer the second; that takes a test.
- What are you comparing the number with? If it moved sharply after a release or disagrees with another source, reconcile the data first.
A metric with a definition
The accountant needs one number, but people on the team mean different things by "active salon". To the product manager it is a salon where someone logged in during the week, to support it is a salon with online bookings in the last month, to the accountant it is a salon that paid. Without an agreement, the investor report will carry one number and the founder's deck another. So the answer starts with a one-line definition, and that line lives in a shared metrics glossary:
Active salon: a salon that has paid its subscription for the current month. Source: the payments table in the service's database. As of 31 October: 1,200. The analyst changes the definition, and only together with the founder.
The marketer needs a metric too, with one addition: the date when it can be calculated. The budget is decided on the cost of a salon that paid, not the cost of a sign-up. For September the channel table already exists: a paying salon from Instagram cost 48,000 ₸, one from Google search 37,500 ₸. The analyst writes back: October's salons finish their trials by mid-November, so October can be judged after 15 November, and on September's figures a salon from Instagram costs 10,500 ₸ more. The December decision waits until that date.
A dashboard
The founder's answer is ready within an hour. The breakdown by channel shows that the share of salons with online booking did not fall in any channel. The overall share dropped because Instagram, where roughly one salon in three turns booking on, brought 75% of new salons instead of 60%. The founder gets three sentences, and the developers stop combing through releases.
But the question will come back. The founder looks at activation every week, and the mix of new salons can shift again. So the channel breakdown moves onto the weekly dashboard, next to the overall share. A dashboard holds what someone makes a decision on regularly; a one-off question stays a number in the chat.
A test
With the button that sends clients tomorrow's free slots, the question is about the future: will salons take more bookings if they see it? The button did not exist before, so past data has nothing to say. The analyst sits down with the product manager to write a test plan: split by salon, not by user, put support requests next to the main metric, and run the test for at least three weeks, because in the first days existing salons press a new button out of curiosity.
Reconciling the data
The riskiest request is the one where a number dropped right after a release: the team is ready to fix the product before anyone has looked at the data. In the first day after the iPhone app update, 500 people requested a login code, but the login confirmation event (the app sends it on top of the event plan) reached analytics for only 300 of them, or 60%. Before the update it was about 90%. The designer is already drawing a new screen.
The analyst first opens the log of the server that sends and checks the codes. There, 450 of the same 500 people confirmed their login, the same 90%. Matching records by user ID, the analyst finds 150 people who have a login on the server and no event in analytics. All 150 are on the new iPhone version, and all of them have booking_created after logging in: they created bookings in the calendar. Login works; the event gets lost.
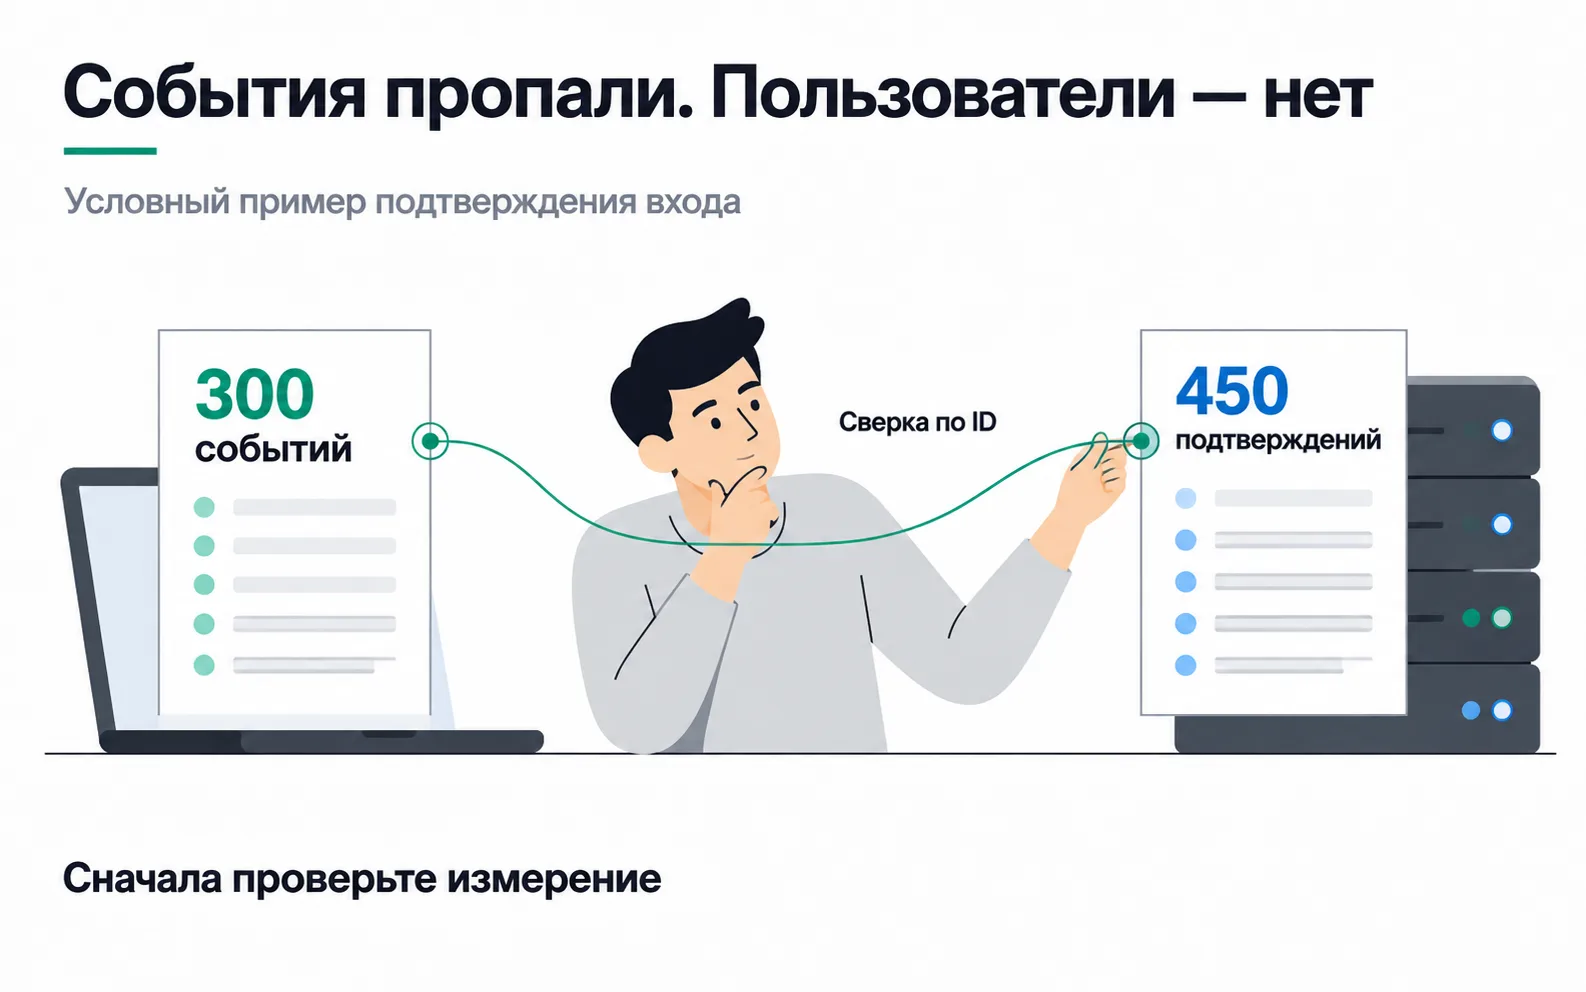
The note to the team keeps what is known apart from what is a guess:
Known: 150 of 450 confirmed logins from the new iPhone version did not reach analytics, and login works for these people. Hypothesis: on one of the login paths the app does not send the event. Next: a developer repeats the login on an iPhone and finds where the event gets lost. Until the fix, the login chart is not used to judge the code screen.
The screen is not redesigned. Once the event is fixed, the days with missing data are marked on the login chart; otherwise in a month someone will spot the dip and start the investigation all over again.
How a product analyst differs from a marketing analyst
Most of this course is about a marketing analyst's work: UTM tags, GTM, GA4, pixels, end-to-end analytics. A product analyst works on the same business, but from the other side of the sign-up.
| Marketing analyst | Product analyst | |
|---|---|---|
| Where the questions are | Before the sign-up, the lead or the first purchase | After the sign-up: activation, payment, repeat use, churn |
| Where the data comes from | Ad accounts, GA4, CRM | Event analytics, the product database, payments |
| What gets counted | Clicks, leads and buyers by campaign | Accounts and people by cohort |
| Who asks | Marketer, media buyer, business owner | Product manager, founder, developers, support |
The line runs along the sign-up, and that is exactly where both are needed. The "channel to paying salon" table is built from two halves: marketing analytics brings the spend and the tags, product analytics brings activation and payments. At the booking service one person does both halves. For you this means product analytics does not start from zero: you already know tags, ad accounts and key events. What you still need: cohorts and funnels by account and tests with flags (that is module 12), plus SQL against the product database, which you will have to pick up separately.
Which project to take first
A first product analytics client is a small subscription service or app: an online school with a student account, a booking service, a delivery service. You look for them in the same places as marketing clients, through the channels for first projects, including subcontracting for studios that build apps to order. Take a task with a clear deliverable and a clear way to sign it off:
| Project | What you hand over | Why it suits a beginner |
|---|---|---|
| A "channel to paying customer" table | Spend, sign-ups, activations and payments by channel and sign-up month, plus a one-page note | Half the work is tags and ad accounts, which you already know |
| An event audit | Gaps between the event plan and what actually arrives, a reconciliation of the key event against the database, a brief for the developers | Every gap can be shown on a test account |
| A weekly activation dashboard | The share of new accounts that reach activation, by sign-up week and broken down by channel | One metric, one definition, sign-off by checking against the database |
The channel table is the easiest one for a client to value: the ad budget is split on it, and its worth shows up in tenge. On a quote built from hours it takes about 18 hours: access and getting to know the database, tags and the sign-up source, exporting spend, the query, reconciling payments with the payment system, the table and the note. At 4,000 ₸ an hour, as in the sample quote, plus 20% for messages and revisions, that comes to 86,400 ₸, rounded up to 90,000 ₸.
If the dashboard will live in Data Studio (formerly Looker Studio, renamed in April 2026), find out about two limits of a direct PostgreSQL connection before you quote: a developer has to open the database to Google's addresses, and one query returns at most 150,000 rows (connecting to PostgreSQL). The salons' calendars collect about 360,000 bookings a month, so the dashboard connects to a ready-made weekly table rather than raw bookings.
Do not start with "be our part-time analyst" without a list of deliverables. That is the request queue from the start of this lesson with no quote and no end, and a month later nobody will be able to say what they paid for. Put off a programme of A/B tests too: at 200 new salons a month the guided setup test needs almost four months, and the client would wait too long for a first result.
Accounts and the database stay with the client, and you get read access. For the database, ask for a separate read-only user or a copy, not access to the live database: your query must not change salon data by accident. Clients' names and phone numbers are not needed for these tasks. The law On Personal Data and Their Protection explicitly lists the full name as an identifier (Article 6); the phone number is not on that list, but it is safer to treat it as personal data too. So ask for an export without names and phone numbers and put that in the contract. This is our reading of the law as amended up to 14 September 2026, and it is not legal advice.
Exercise: a request log
Take a project you work on. If you do not have a client yet, ask a founder you know which numbers they look at every week and what they decide based on them, or use the booking service from this lesson.
Now a question you will get. On Friday the founder writes: "Make me a dashboard with all the events by Monday, I want to see everything." What do you reply?
The service's event plan has fewer than ten events, and they can produce dozens of charts, so on Monday the founder would get forty charts and no decision to take from them. Ask what he decides every week. If the main decision is how much to spend on ads and in which channels, three numbers cover it: new salons by channel, the share that turned on online booking within 7 days broken down by channel, and cost per paying salon by sign-up month. Everything else the founder can ask in the chat, and a question that comes up a third time moves onto the dashboard as well. On Friday you could reply: "Let's take 15 minutes on Monday: you name the decisions you make every week, and by Wednesday there will be a dashboard for the first of them."
Video: the product analyst profession
An overview of the profession from the TeachMeSkills programming school.