An online school in Almaty sells an analytics course for 25,000 ₸. All its ads lead to a single page with a sign-up form, and every week the school's WhatsApp gets the same questions: does the price include homework review, do the lesson recordings stay available. At the team meeting everyone has an idea. The designer wants to recolour the button, the copywriter wants a new headline, the manager asks to cut the extra fields from the form. There is neither the time nor the developer to do it all at once, and someone has to decide where to start.
That is what CRO (conversion rate optimization) is for: finding out why the right people leave without submitting the form, and changing the page so that they do submit it. In this lesson you will write the school's ideas up as hypotheses that can be checked, rank them with ICE, and work out what to do with the first one when there isn't enough traffic for an A/B test. The school's figures are an example.
First fix what is broken
Not everything on a page is a hypothesis. If the form won't submit from an iPhone, the button slides off the edge of the screen, or the site says the course costs 25,000 ₸ while the ad says 20,000 ₸, those are bugs. You fix them right away, with no scoring and no tests: there is nothing to learn from comparing against a version where the form doesn't work.
The easiest way to find such bugs is to go through the page yourself. Open it on your phone from the link in the ad, submit the form with a typo in the phone number, then correctly, and wait for the manager's message. Anything that breaks along the way goes on the list of fixes, not the list of hypotheses.
Where hypotheses come from
A hypothesis starts with an observation: people do something on the page you didn't expect. The school has three sources of observations, and yours will be the same.
- Questions on WhatsApp and the phone. If someone asks the manager about something the page should cover, the page didn't answer that question. Over two weeks the school counted 30 questions from people who hadn't signed up yet, and 12 of them were about what the course includes.
- Events in GA4. Enhanced measurement sends
form_startthe first time a user interacts with a form in a session. Put it next togenerate_leadfrom the GA4 setup and you can see how often the form was started and not sent. At the school,form_startfired 320 times in a week andgenerate_lead69. - Session recordings. Microsoft Clarity records how visitors behave on the page for free and builds heatmaps. A dozen recordings of people who started the form and gave up will show which field they stopped at.
An observation doesn't name the cause yet. Behind the gap of 251 forms started and not sent there could be the "Job title" field, a phone call halfway through, or someone who opened the form just to see what it asks. A hypothesis picks one explanation, and that explanation still has to be checked.
How to write a hypothesis that can be checked
"Make the form easier to use" is a wish: it's unclear what to change and how you would tell whether it worked. A hypothesis is written as one sentence in four parts:
If we change [what exactly], then [metric] will move [which way], because [what we saw]. We'll check using [data] over [period].
For the questions about the course contents it reads like this:
If we show what the 25,000 ₸ includes next to the sign-up button (homework review, lesson recordings, a chat with a mentor), then the share of visitors who submit the form will rise and there will be fewer WhatsApp questions about the contents, because 12 of the 30 questions over two weeks were about exactly that. We'll check using leads in the CRM and questions on WhatsApp over the four weeks after the change.
Each part has its own task. "What we change" can go to a developer with no further explanation. The metric and its direction are named before launch, so it is clear in advance which result means admitting it didn't work. "Because" points to something you saw. If the only thing you can put there is "we think so", that is an answer too: the hypothesis gets a low confidence score in ICE.
ICE: three scores and what the total means
ICE helps you choose where to start when you have more ideas than hands. As GrowthHackers describes it, each idea is scored on three scales from 1 to 10, and on all three higher is better.
- Impact. How far the target metric will move if the hypothesis is right. Count how many visitors the change touches: everyone who reaches the form sees a block next to the button, while hardly anyone sees an edit in the footer.
- Confidence. How sure you are that the hypothesis is right. 7-10 if two sources back the observation, such as WhatsApp questions and session recordings. 4-6 if there is one source. 1-3 if it's an opinion.
- Ease. What it costs to make the change. 10 is an hour in the site builder, 5 is a few days of developer time, 1 is weeks of work or a video shoot.
The total is the average of the three: ICE = (Impact + Confidence + Ease) / 3. The same calculation is used in ICE and RICE prioritization, and RICE adds reach to the scores.
The school's five hypotheses after scoring:
| Hypothesis | Impact | Confidence | Ease | ICE |
|---|---|---|---|---|
| A "What the 25,000 ₸ includes" block next to the button | 7 | 8 | 9 | 8.0 |
| Remove the "Company" and "Job title" fields from the form | 7 | 6 | 8 | 7.0 |
| A new headline using the first-screen formula | 6 | 4 | 9 | 6.3 |
| Recolour the button from green to orange | 2 | 2 | 10 | 4.7 |
| A video clip from a lesson on the first screen | 5 | 3 | 3 | 3.7 |
The course contents block gets confidence 8 because two sources stand behind it: the WhatsApp questions and Clarity recordings in which people scroll back up to the course outline before reaching the form. The form gets 6: GA4 shows that people abandon it but not why. The headline rests on reasoning, not on data from this page. The button colour and the video have nothing behind them yet but taste.
Now the total. The 8.0 for the contents block is not a forecast of "plus 8%" and not an 80% chance of success. It's a place in the queue: of the five ideas, this one should go first. Scores can only be compared within one list, scored by the same people on the same scale. And look at the individual scores, not just the total. The button beat the video on ease alone: Impact 2 and Confidence 2 say there is nothing to expect from it, it's just cheap.
Scores change as data comes in. If the session recordings show that people abandon the form at the "Job title" field, confidence in the second hypothesis rises to 8, and with a total of 7.7 it nearly catches up with the first.
A/B test or ship and watch
The strictest way to check a hypothesis is an A/B test: visitors are split at random between the old and new version of the page, and the results are compared statistically. Randomness is what makes the groups differ only in the page they saw, not in the day of the week, the ads or the audience.
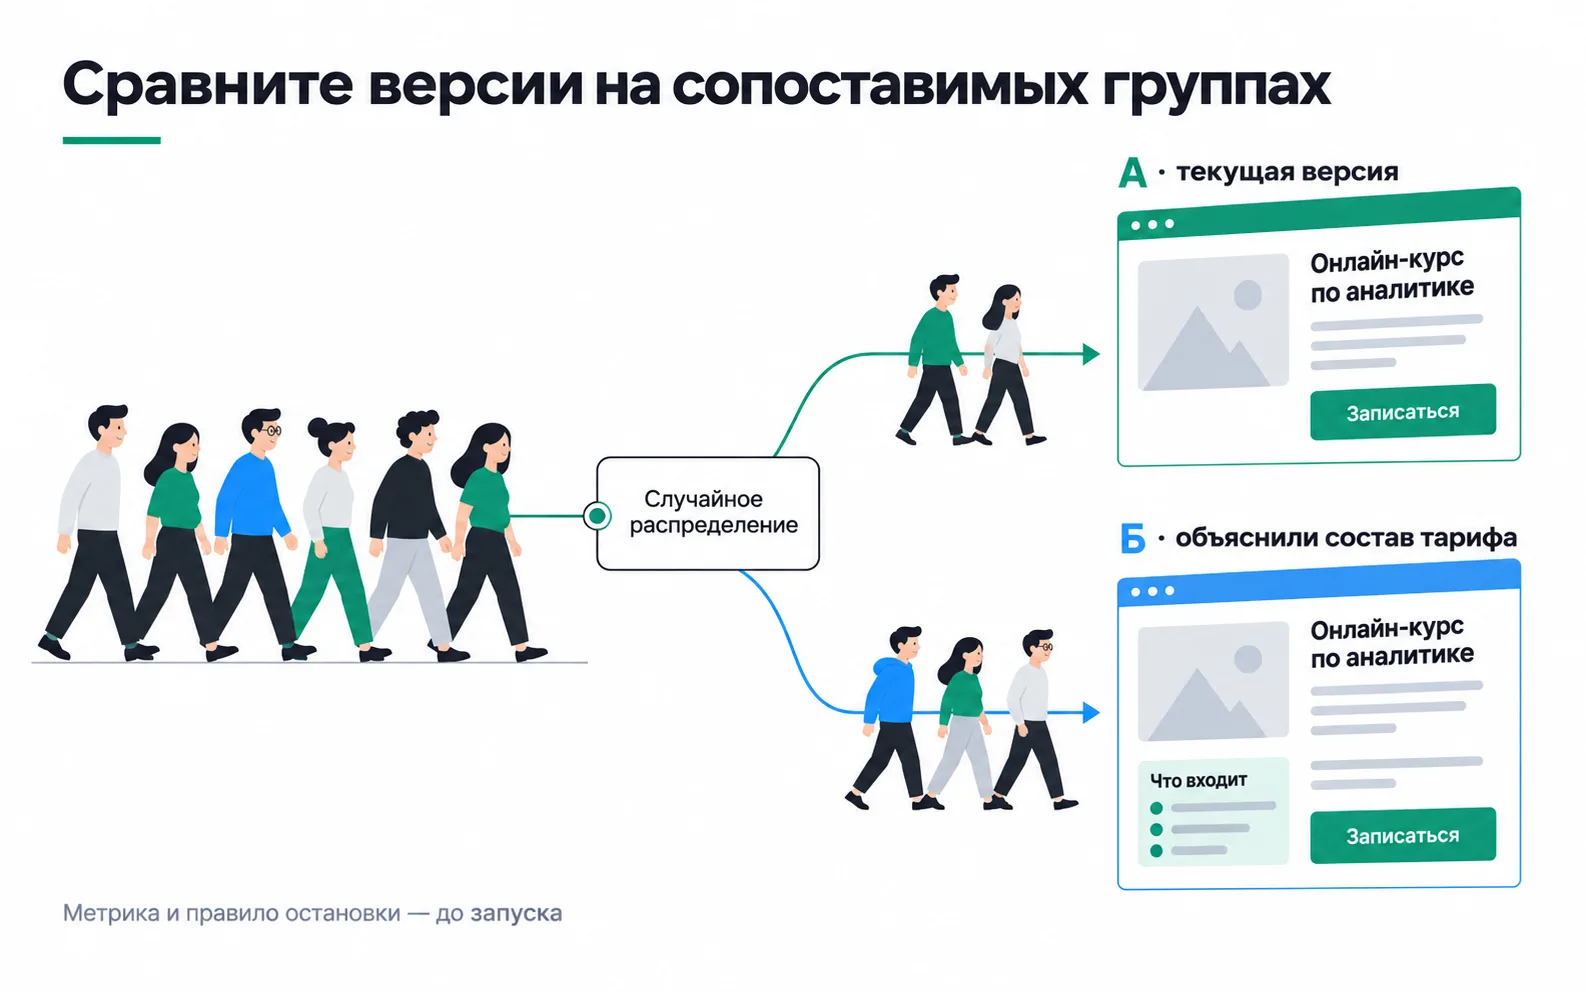
But a test needs people. The school gets about 2,500 visitors and 69 leads a week (40 from Instagram and Facebook, 20 from Google, 9 from Telegram, as in the UTM tagging example), which is 34-35 leads per version. On numbers like these, a small difference between versions takes months to show up. Your page from the Start track has even less traffic: the example week 2 test had 171 clicks and 11 leads. Split those in half, and one lead either way flips the conclusion.
At this level of traffic, none of the hypotheses on the list can be checked with an A/B test in a reasonable time. They are shipped and watched. Once there is enough traffic for a real A/B test, its sample size is calculated in advance.
How to ship the first hypothesis and watch it
The school starts with the "What's included" block. Shipping without a test doesn't mean ship and forget. Here is the order:
- Write the date, what you changed and what you expect to see in a hypothesis log. Without the date, nobody will remember a month later when the block went up.
- Change nothing else on the page that week, and if you can, nothing in the ads either. Otherwise you won't know which of the two changes moved the numbers.
- Watch what the hypothesis predicted: the share of visitors who submit the form, and the number of WhatsApp questions about the course contents. The questions are especially handy because you can see them without any test, and if there are no fewer of them, the block probably doesn't answer them, whatever happens to leads.
- Look at lead quality: how many leads went on to pay, according to the CRM. If there are more leads but the same number of payments, the new leads are not getting as far as payment, and you need to find out what stops them.
- After four weeks, compare with the four weeks before the change and write the conclusion in the log.
The conclusion from this kind of comparison is more modest than from a test. The weeks before and after differ in more than the page: the ads may have changed, enrolment for a new cohort may have opened, the holidays may have ended. So the report says what you saw, not what caused it. For example: "In the four weeks after the block went up, the share of visitors who submitted the form was 3.1%, against 2.8% in the four weeks before. Ads and price did not change. Questions about the course contents over the last two weeks: 3, compared with 12 before the change." The phrase "the block raised conversion" doesn't belong here: only a test can show the cause.
If the share of leads drops and stays lower for two or three weeks, and the questions haven't gone down, roll back to the old version and record that in the log. The next hypothesis starts from that entry.
Exercise: five hypotheses for your landing page
Take the landing page your week 2 campaign in the Start track pointed to.
The exercise is done when five hypotheses have ICE scores and the first one is implemented.
Now look at the Confidence column. If a hypothesis scores 7 or more there but its "because" has not a single observation from your list, the score is inflated: confidence comes from data, not from how much you like the idea. If the "because" says "competitors do it", that is a reason to form a hypothesis, but its confidence is low: you don't know whether it works for them. And if the simplest edit, with Impact 2, came out on top, start with the next row where impact and confidence are higher, and make the simple edit once the observation period for the first one is over, recording its date in the log.
After four weeks, go back to the log and compare the numbers before and after. The hypothesis, its score, what you did and what you saw already make material for a case study in your portfolio.