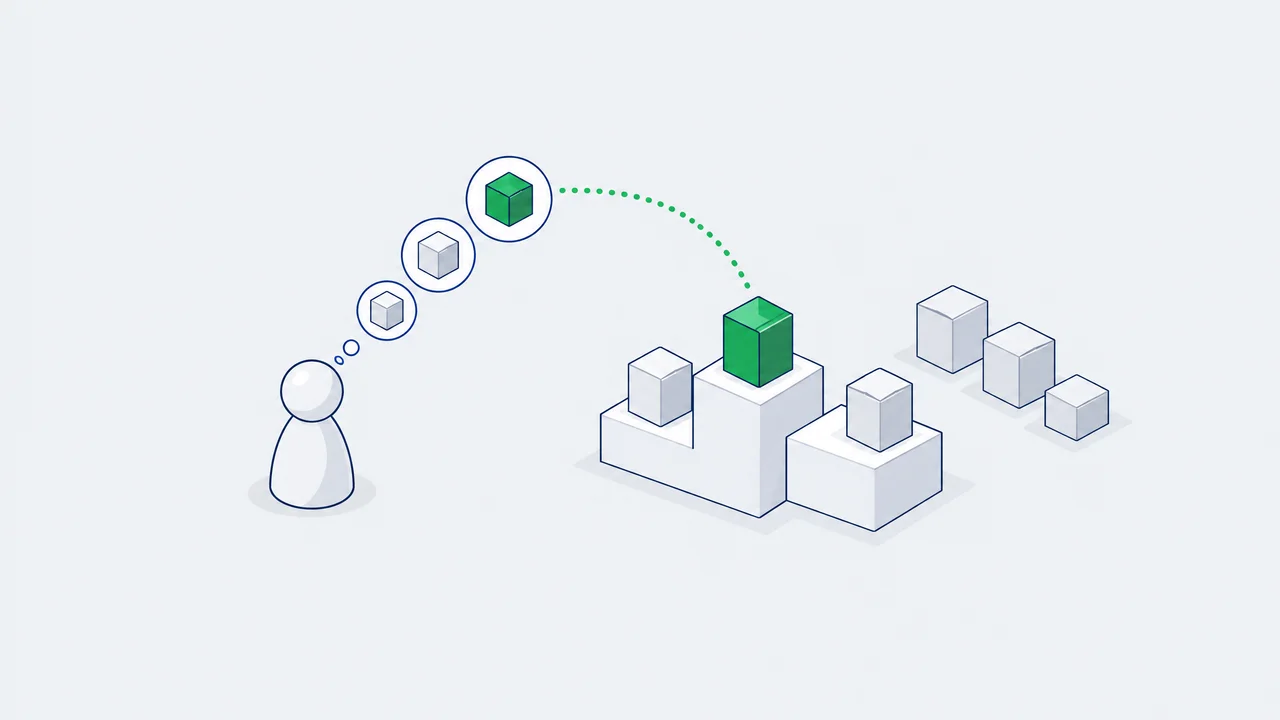
Brand awareness is three numbers, not one. Top of mind is the brand a person names first. Spontaneous awareness is every brand they name without help. Aided awareness is every brand they recognise in a list. Each is a share of a sample, so each comes with an error, and most of what gets presented as "awareness grew" is inside that error.
With 600 respondents per wave the margin on any one figure is up to 4.0 points, and a change between two waves has to reach roughly 5 to 8 points before it can be told from noise. This piece covers the questions, their order, and the arithmetic for reading a tracker.
Three levels of knowing a brand
The definitions are standard across research agencies. In the Ipsos wording: spontaneous awareness is the share of people who can name a brand without assistance, top of mind is the first brand mentioned within that, and prompted awareness is the share who say they know a brand after being shown a stimulus.¹ The ladder goes back to the awareness pyramid in David Aaker's Managing Brand Equity (1991): unaware, recognition, recall, top of mind.
Top of mind
The first brand named in answer to an open question about the category. One brand per respondent, so across all brands it adds up to 100% of the people who named anything.
Spontaneous (unaided)
Every brand named in answer to the same open question, first or not. It measures recall: the brand comes to mind from the category alone.
Aided (prompted)
Every brand ticked in a list. It measures recognition, which is easier than recall, so the figure is always the highest of the three.
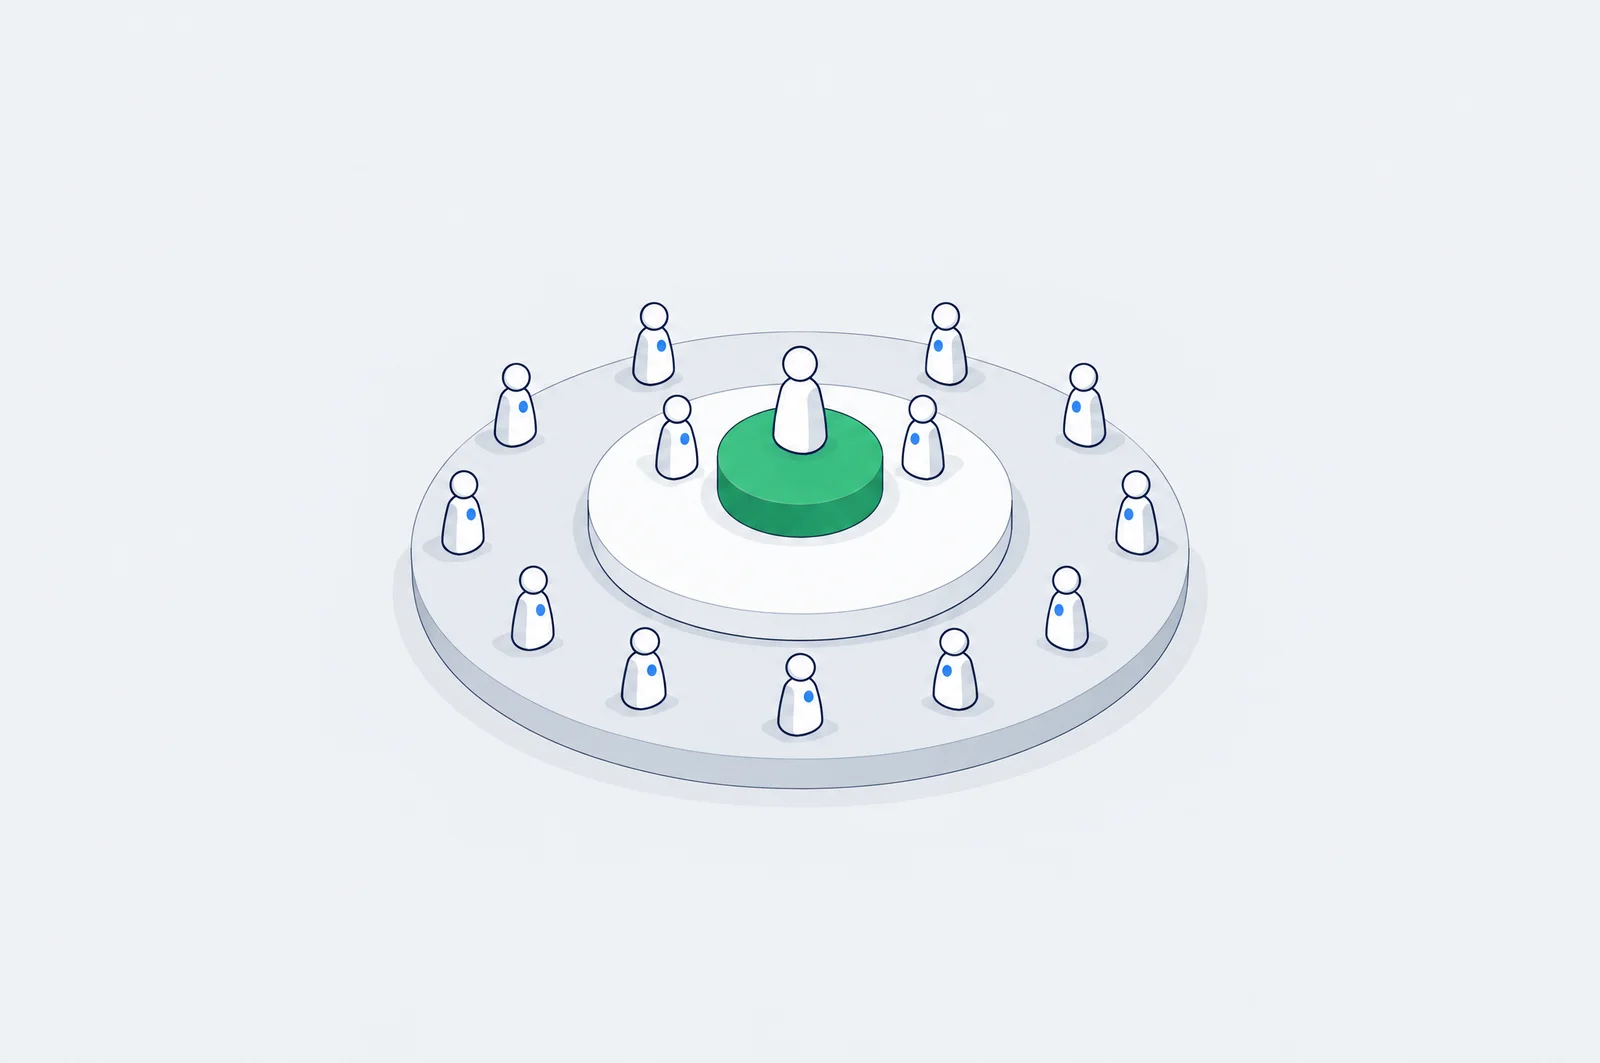
The three are nested. Whoever names you first has named you, and nearly everyone who names you unprompted will tick you in a list.
The questions and their order

Category question, no brand names
- "Which banks can you name?"
First mention
- top of mind, stored separately from the rest
All other mentions
- spontaneous awareness, after the probe "any others?"
List in random order, with a decoy
- aided awareness: "Which of these have you heard of?"
Questions about your brand
- ad recall, consideration, usage: only now
Unaided before aided, always
The Encyclopedia of Survey Research Methods puts it as a rule: aided questions come after unaided ones on the same topic, otherwise they bias the unaided answers.² The same goes for the survey invitation and the screener: no brand name, no logo.
The cue is part of the measurement
"Which banks can you name?" and "Where would you go for a business loan?" produce different lists. Fix the wording once and do not touch it between waves.
Record the first mention separately
Top of mind is the first answer, not the first one in alphabetical order after coding. Keep the order of mentions in the data, then probe with "any others?".
Randomise the list, add a decoy
The aided list is shown in random order. A fictional brand in it shows how many people tick names they have never seen; SurveyMonkey's guidance recommends at least one.³
How much the format matters: in a Pew Research test 58% of respondents picked "the economy" when it was offered as an option, and 35% named it when the same question was open-ended.⁴ That gap is the gap between aided and unaided awareness.
Run the questionnaire in Kazakh and in Russian, and code the open answers before counting. The same brand arrives in Latin and in Cyrillic, with and without "bank", shortened and misspelt. Uncoded, it becomes five small brands instead of one.
Reading two waves
An illustrative tracker: two waves of 600 respondents, before and after a campaign.
| Metric | Wave 1 | Wave 2 | Change | z | p-value | At 95% |
|---|---|---|---|---|---|---|
| Top of mind | 8% | 11% | +3 points | 1.77 | 0.076 | not significant |
| Spontaneous | 21% | 27% | +6 points | 2.43 | 0.015 | significant |
| Aided | 55% | 59% | +4 points | 1.40 | 0.162 | not significant |
Everything went up, and only one of the three changes can be reported as a change. Two formulas produce that table. The margin of error of one figure at 95% confidence:
For spontaneous awareness in wave 1 that is 21% plus or minus 3.3 points; for top of mind, 8% plus or minus 2.2. And the test for a difference between two waves, with the pooled share p̄ of both waves together:⁵
A z above 1.96 in absolute value is significant at 95%. Top of mind moved by 3 points and missed it; aided moved by 4 and missed it by more, because shares near 50% are the noisiest.
Check your own waves:
Wave-to-wave change calculator
Starts with spontaneous awareness from the worked example. Works for any yes/no tracker question.
The change is statistically significant at 95%.
How big a wave has to be
The margin of error at the worst case, a share of 50%:
| Respondents per wave | Margin at 95% |
|---|---|
| 200 | ±6.9 points |
| 400 | ±4.9 points |
| 600 | ±4.0 points |
| 1,000 | ±3.1 points |
| 1,500 | ±2.5 points |
| 2,400 | ±2.0 points |
The margin shrinks with the square root of the sample: four times the respondents halves it. AAPOR's explainer makes the same point from the other side: a subgroup of 200 carries about ±6.9 points, and doubling a sample from 1,000 to 2,000 buys about one point.⁶
The margin of one figure is not what a tracker needs, though. A tracker compares waves, and the smallest change two equal waves can detect (95% confidence, 80% power) is larger:
| Respondents per wave | Base 10% | Base 20% | Base 50% |
|---|---|---|---|
| 300 | 7.9 points | 9.9 points | 11.3 points |
| 600 | 5.4 points | 6.8 points | 8.1 points |
| 1,000 | 4.1 points | 5.2 points | 6.2 points |
| 2,000 | 2.8 points | 3.7 points | 4.4 points |
Read it as a planning table. If the campaign can plausibly move spontaneous awareness from 20% by 4 points, waves of 600 will not show it and waves of 2,000 will.
The ratios between the levels
The levels are more useful together than alone. In the example:
- Top of mind as a share of spontaneous: 8 / 21 = 38% in wave 1, 11 / 27 = 41% in wave 2. Of the people who recall you, how many think of you first.
- Spontaneous as a share of aided: 21 / 55 = 38% in wave 1, 27 / 59 = 46% in wave 2. Of the people who recognise you, how many recall you unprompted.
A low second ratio describes a brand people have seen and do not think of: a salience problem that more reach will not fix. A high aided figure with a weak first ratio describes a brand that is known and is nobody's first choice. These ratios divide one noisy number by another, so they are noisier than either. Use them to form a question, not to report a result.
Weighting costs sample
Samples rarely match the population, so they are weighted. Weighting corrects the mix and reduces the effective sample size. Kish's formula:⁷
A small example. People aged 18 to 34 are 40% of the population and 60% of the sample: 360 of 600. Everyone else is 240 of 600. The weights are 0.67 for the younger group and 1.50 for the older one. The sum of weights is 600, the sum of squared weights is 700, so the effective sample is 600² / 700 = 514 and the design effect is 1.17. The worst-case margin goes from 4.0 to 4.3 points.
That is a mild case. One Pew Research survey reports a design effect of 1.75, which would turn 1,000 completes into about 571 effective respondents.⁷ Ask the vendor for the effective base, not the number of completes.
Where the sample comes from
Many trackers run on online opt-in panels, and the arithmetic above assumes something those panels are not: a random sample.
AAPOR's report on online panels advises against nonprobability panels when the aim is an accurate estimate for the population.⁸ In a Pew comparison, an opt-in poll had 20% of adults under 30 agreeing with a fringe statement that 3% agreed with in a probability panel.⁹
Read changes, not absolute levels
Pew found that the best adjustment removed about 30% of the bias in opt-in samples.¹⁰
Keep the panel, the quotas and the method identical in every wave
An online panel and a face-to-face study measure different people in different ways.
Never put two vendors' awareness figures on one chart
Two facts for Kazakhstan. The population was 20,618,796 on 1 September 2026,¹¹ and DataReportal counted 19.5 million internet users, 93.4% of the population, in its Digital 2026 report,¹² so an online panel can in principle reach most adults; check its age and region mix against official statistics before the first wave. And the tool many teams in the region used for quick brand polls is gone: Yandex Vzglyad stopped accepting paid surveys on 20 March 2026.¹³
What top of mind does not measure
It is zero-sum
One first mention per person. Your top of mind can fall in a wave where your spontaneous awareness rose, because a competitor advertised harder. Read it as a share, next to the competitors' figures.
It uses one cue
Byron Sharp's objection is that top of mind and similar measures use a single cue, the category name, while people reach brands through many situations.¹⁴ Jenni Romaniuk's alternative measures links between a brand and a set of category entry points, and reports mental market share, mental penetration and network size.¹⁵
It is not a sales forecast
A cheap companion is share of search: the brand's share of search queries among competitors. Les Binet showed it correlating with market share in three categories (cars, energy, mobile handsets) and leading it by up to a year for cars.¹⁶ Three categories, and brand names that are also ordinary words break it.
A tracker is not a lift study
A change between two waves is not the effect of the campaign that ran between them. The season changed, competitors launched, the news cycle moved. A tracker says where the brand stands. To say what a campaign caused you need a control: people who could not see it.
How wrong can the before/after reading be? I simulated 4,000 trackers in a market where spontaneous awareness of the whole category climbs 0.7 points a wave, with 600 respondents a wave and no campaign at all, and compared three waves "after" with three waves "before". The check itself is the one Google's paper on geo experiments uses: run the method where the true effect is zero.¹⁷
| Comparison | "Significant" change at 95%, no campaign | What it should be |
|---|---|---|
| Before/after in one region | 30.6% | 5% |
| The same change minus the change in a control region | 5.2% | 5% |
Between the two blocks of waves the market moved 2.1 points on its own, and a before/after test cannot tell that from a campaign. A control region drifts with the market, so subtracting its change removes the drift. That is a difference-in-differences:
It costs a second sample and a wider interval, four proportions' worth of noise instead of two. It is also the only version of the number that survives a moving market.
Tracker
The level of awareness over time, with competitors. Repeated waves, same method.
Brand Lift study
What one flight changed, measured against a held-out group on the ad platform. See Brand Lift studies.
Conversion lift
What the ads did to sales, not to answers. See conversion lift.
If the budget is below the platforms' Brand Lift minimums, a survey of your own can still carry a control cell: a region where the campaign did not run, surveyed in the same waves with the same questions. Read the difference between the two regions' changes, as above, not the change in one.
Before each wave
Tick them off as you go; the marks stay in this browser. 0 of 8 done
The takeaway
Awareness is three nested shares: top of mind, spontaneous, aided. Ask them in that order and never show the brand first. At 600 respondents a figure carries up to 4.0 points of margin and a change needs 5 to 8 points to be real. Choose the sample from the change you expect. A tracker shows the level. What a campaign caused takes a control group.
The sample-size logic is the same as for an A/B test: the experiment calculator on this site uses the same two-proportion formula.
¹ Awareness - Ipsos Encyclopedia
² Lavrakas (ed.), Encyclopedia of Survey Research Methods, SAGE, 2008: Aided Recognition
³ How to measure brand awareness - SurveyMonkey
⁴ Writing survey questions - Pew Research Center
⁵ NIST/SEMATECH e-Handbook of Statistical Methods: confidence intervals for a proportion, comparing two proportions
⁶ Margin of sampling error - AAPOR
⁷ Design effects - PracTools, Zipf and Valliant; survey methodology with a design effect of 1.75 - Pew Research Center
⁸ AAPOR Report on Online Panels - Public Opinion Quarterly 74(4), 2010
⁹ Online opt-in polls can produce misleading results - Pew Research Center, 5 March 2024
¹⁰ For weighting online opt-in samples, what matters most? - Pew Research Center, 26 January 2018
¹¹ Demographic statistics - Bureau of National Statistics of Kazakhstan
¹² Digital 2026: Kazakhstan - DataReportal
¹³ Yandex Vzglyad help: creating a survey
¹⁴ How to measure brand salience - Ehrenberg-Bass Institute
¹⁵ Romaniuk (2022). Category Entry Points in a B2B World. LinkedIn B2B Institute and Ehrenberg-Bass Institute
¹⁶ Binet presents the share of search metric - IPA, 14 October 2020
¹⁷ Ye, Sinn, Li, Jiao (2026). Meridian GeoX: An Open-Source Framework for Precision and Efficiency in Geo Experiments. Google, 1 September 2026
FAQ
How many respondents does a brand tracker wave need?
It depends on the change you need to detect. Two waves of 600 can detect a change of about 6.8 points from a 20% base at 95% confidence with 80% power; waves of 1,000 detect 5.2 points and waves of 2,000 detect 3.7. Subgroups need their own count: a segment of 200 carries a margin of about ±6.9 points.
What is a good top-of-mind level?
There is no universal number. Top of mind is one first mention per person, so it is split between all the brands in the category. Read it against competitors in the same survey, not against a benchmark from another category.
Why did aided awareness not move after a large campaign?
Aided awareness is the highest of the three figures, and shares near 50% have the widest margin. A 4-point change at 600 respondents per wave is not statistically significant. Check spontaneous awareness and the sample size before concluding anything.
Can I compare my online panel results with an agency's face-to-face study?
No. The sample source, the interview mode and the question context all differ, and opt-in online panels are not reliable for absolute levels. Compare waves of the same tracker with each other.
Does a rise in awareness between two waves prove the campaign worked?
No. Season, competitors and news move awareness too. To attribute a change to a campaign you need a control group that could not see it: a Brand Lift study on the ad platform, or a control region in your own survey.
Seeing this in your own funnel?
Two weeks, fixed scope, read-only access. You get the findings and a 90-day roadmap whether or not we work together afterwards.