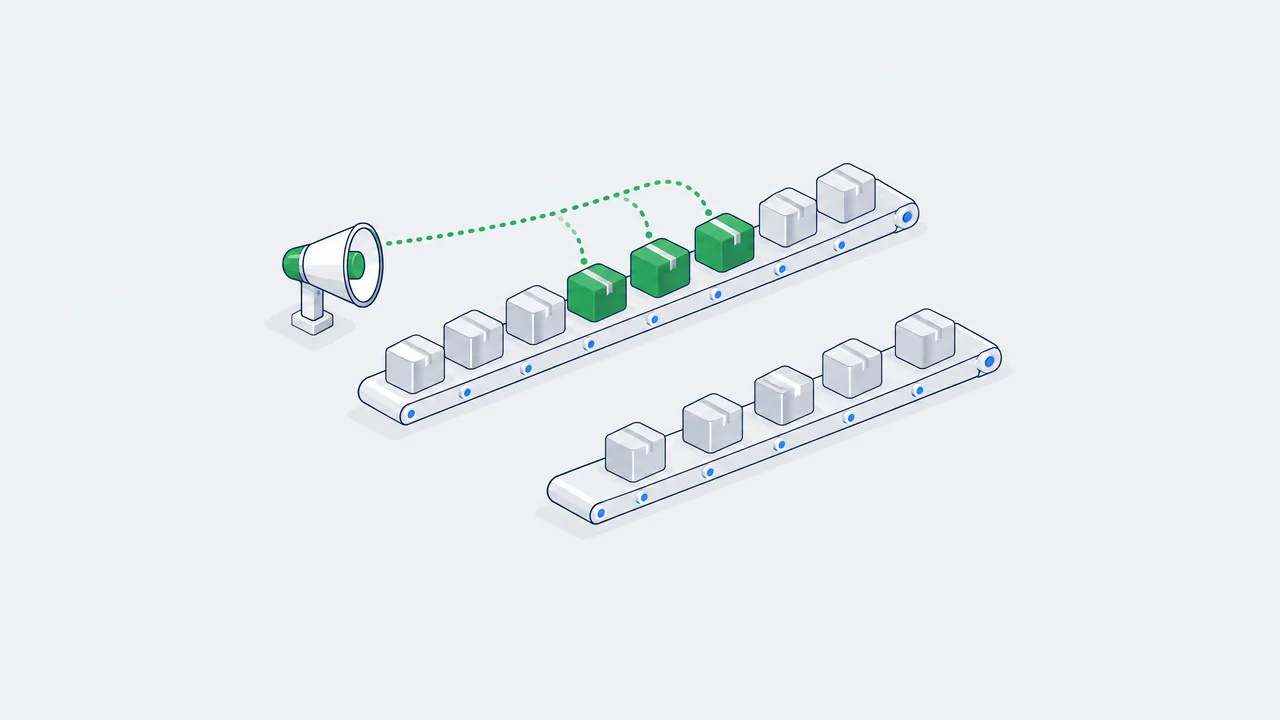
Attribution counts the conversions that happened after an ad. A conversion lift test counts the ones that happened because of it. The platform withholds your ads from a random slice of the audience, lets everything else run as usual, and compares conversion rates between the two groups. In the worked example below the ad platform claims 3,000 conversions and the experiment finds 900.
Whether your account can measure a number like that depends mostly on one thing: how many conversions land in the control group. Below a certain count the test runs, costs you the withheld sales, and tells you nothing.
Platform requirements below were checked on 5 October 2026 against each vendor's help pages.
Why attribution cannot answer this
Attribution distributes credit for conversions that already happened. It has no view of the people who would have converted without the ad, and those people are exactly who retargeting and brand search are best at finding.
The size of the gap has been measured. Gordon, Moakler and Zettelmeyer compared 663 Facebook experiments with what standard observational methods said about the same campaigns. Median experimental lifts were 29%, 18% and 5% for upper-, middle- and lower-funnel outcomes. Double machine learning on the same data reported 83%, 58% and 24%. Propensity score matching reported 173%, 176% and 64%.¹ Blake, Nosko and Tadelis switched off eBay's brand-keyword search ads and found no measurable short-term benefit from them.²
Meta says the same about its own tools: a lift test counts all conversions in both groups, so its numbers will not match what Ads Manager attributes.³
How the test works

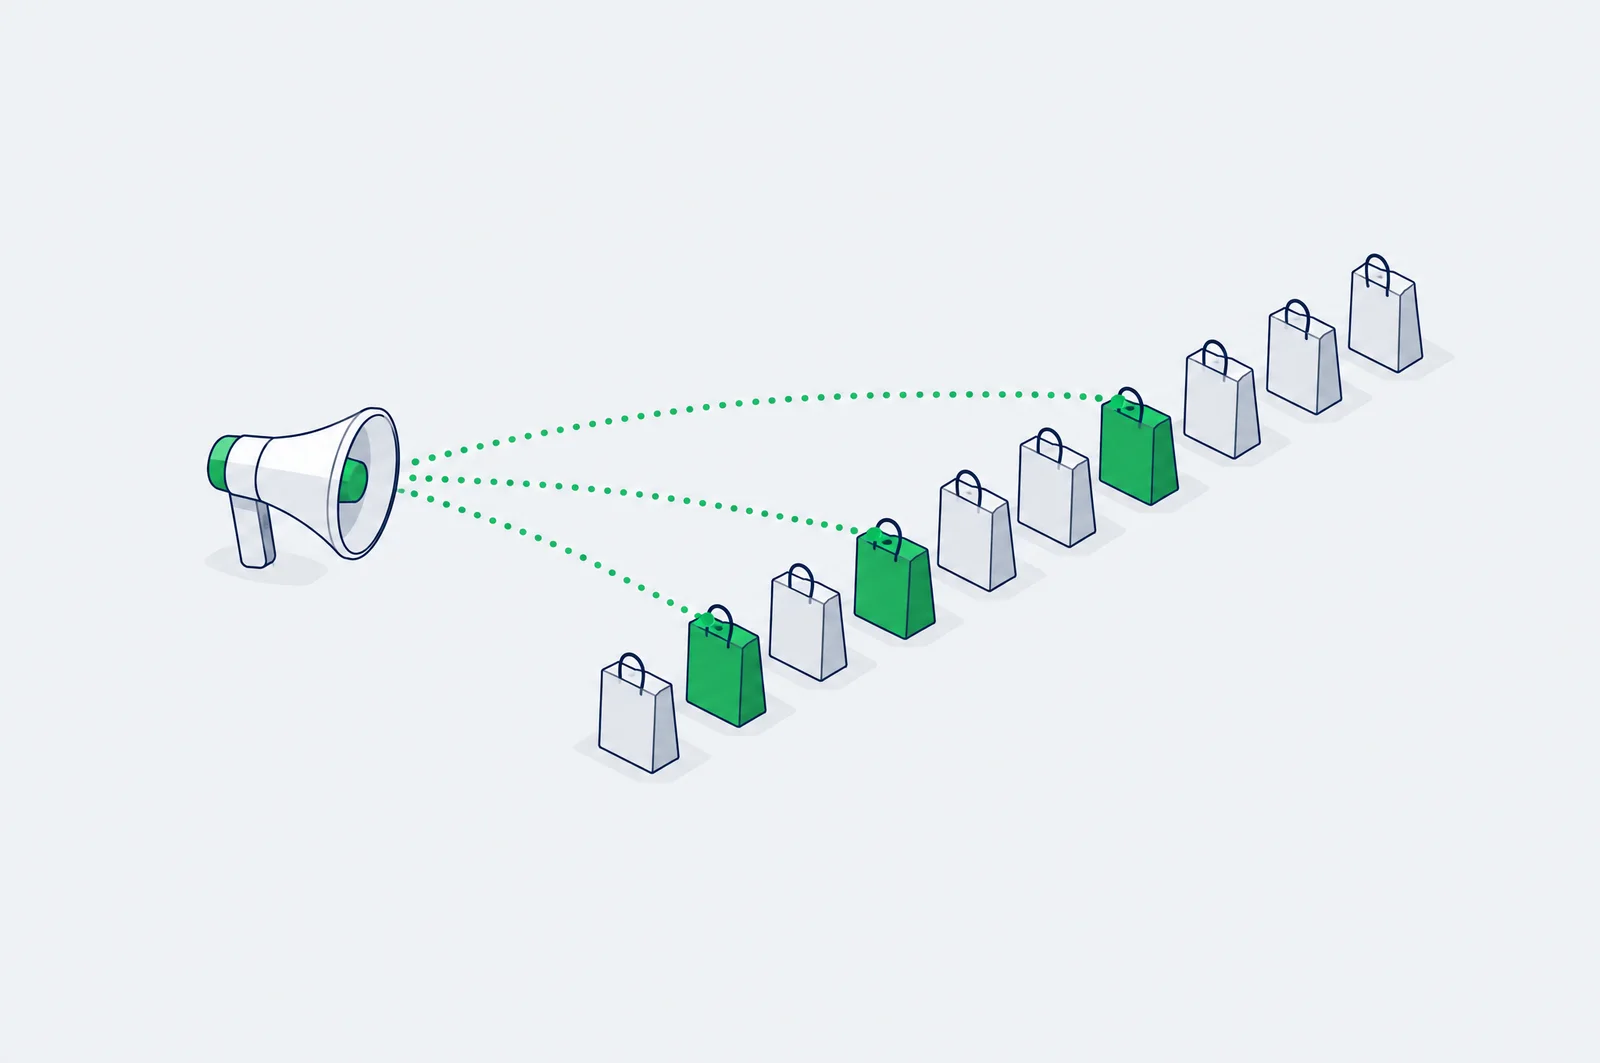
Eligible audience
- everyone the campaign could reach

Random split
- per person, before delivery, fixed for the whole test

Ads for the test group only
- the control group is held out, their other channels keep running

Every conversion counted in both groups
- no attribution window, no click requirement
Incremental conversions
- test group minus the control group scaled to the same size
The assignment is at the level of the person and stays fixed for the whole test.³ Everything else in the control group's life continues, including your other channels, and a conversion is counted whether or not anyone clicked.
It is intent-to-treat
The test group is everyone who was eligible to see the ads, including the people who never got an impression. Meta states this explicitly.³ You are measuring what the campaign added across the audience it was allowed to reach, not the effect on people who saw it.
The split is rarely even
In a Meta single-cell test the control group is 10% of the size of the test group and is scaled up in reporting.⁴ Google lets you set a holdback from 1% to 50%.⁵ Yandex's Target Lift for display campaigns uses 90% test and 10% control.⁹
The arithmetic
Illustrative numbers, chosen so every step can be checked by hand:
- Test group: 900,000 people, 5,400 conversions. Rate 0.60%.
- Control group: 100,000 people, 500 conversions. Rate 0.50%.
- Spend: ₸9,000,000. Margin per conversion: ₸25,000.
- Conversions the ad platform attributed to the campaign: 3,000.
The control group is nine times smaller, so first scale it to the size of the test group. That is the number of conversions the test group would have produced with no ads:
| Metric | Arithmetic | Result |
|---|---|---|
| Baseline conversions | 500 × 9 | 4,500 |
| Incremental conversions | 5,400 - 4,500 | 900 |
| Lift | 0.60% / 0.50% - 1 | 20.0% |
| Share of test-group conversions caused by ads | 900 / 5,400 | 16.7% |
| Cost per incremental conversion | ₸9,000,000 / 900 | ₸10,000 |
| Incremental ROAS | 900 × ₸25,000 / ₸9,000,000 | 2.5 |
Now put the attribution report next to it. The platform claimed 3,000 conversions: an attributed CPA of ₸3,000 and an attributed ROAS of 8.3. The experiment says 900 conversions, ₸10,000 each, and a return of 2.5.
Seven in ten attributed conversions would have happened anyway. The campaign is still profitable at 2.5. It is not the campaign the dashboard described, and a target CPA set from the dashboard is set 3.3 times too generously.
How sure is it
The lift is a ratio of two rates, and the cleanest way to put an interval on a ratio is on the log scale:
The approximation on the right holds when conversion rates are a few percent or less, and it is worth memorising, because it says what the noise depends on: conversion counts. Not users, not impressions, not spend.
Here SE = 0.0466 (the approximation gives 0.0467). The control group's 500 conversions contribute 92% of that variance. The test group's 5,400 barely matter. This is the cost of a small holdout: it protects revenue and it is where almost all the uncertainty lives.
Google shows an 80% interval and a certainty of one minus the p-value, which amounts to a one-sided 90% test. Meta shows a confidence percentage and calls a result above 90% reliable.⁴ ⁶ In Google's convention:
- Lift: 20.0%, interval from 13.0% to 27.4%. z = 3.91, certainty above 99.9%.
- Incremental conversions: 900, interval from 623 to 1,161.
- Cost per incremental conversion: ₸10,000, anywhere from ₸7,752 to ₸14,449.
The same test at one tenth of the size: 90,000 people with 540 conversions against 10,000 people with 50. The rates are identical and the lift is still 20.0%. The standard error is 0.1474, the interval runs from -0.7% to 45.0%, and the certainty is 89.2%. The true effect has not changed. The test can no longer see it.
90% or more is strong, 70% to 90% is good, 50% to 70% is directional only, below 50% is reported as no lift.⁶ Know the scale before you read the report.
Try it with your own groups:
Conversion lift calculator
Starts with the worked example. Replace the numbers with your test and control groups.
Lift detected. There is a 90% chance the true lift is above 13.0%.
A test with no effect in it
The baseline of 4,500 in the table above looks like a fact. It is 500 conversions multiplied by nine, and the noise in those 500 is multiplied by nine along with them.
To see what that does, I simulated 4,000 tests of a campaign that changes nothing: both groups convert at 0.50%, with 900,000 people in the test group and 100,000 in control. For each one I computed the "incremental conversions" exactly as above.
The true answer in every one of these tests is zero. The measured answer has a standard deviation of 210 conversions, and only 65.3% of the tests land within 200 of zero. Two ways of deciding whether a result is a lift:
| Test | "Lift" found when there is none | What it should be |
|---|---|---|
| The log-ratio interval from the section above | 9.9% | 10% |
| The shortcut: 4,500 is "the baseline", is the test group far from it? | 34.4% | 10% |
The shortcut treats the scaled baseline as a known number, which leaves only the counting noise around 4,500: a standard deviation of 67. The real one is 210, three times wider, and nearly all of the difference comes from the small control group. A slide that says "we expected 4,500 and got 4,700" makes this mistake. Whatever tool does the arithmetic, check that the uncertainty of the control group is inside the interval.
How many conversions you need
Turn the standard error around and you get the control-group conversions required to detect a given lift. One-sided 90% and 80% power give zα + zβ = 2.1232; k is the size of the test group relative to the control group:
| Lift to detect | 50/50: control conversions | 50/50: all conversions | 10% holdout: control conversions | 10% holdout: all conversions |
|---|---|---|---|---|
| 5% | 3,698 | 7,580 | 2,095 | 21,884 |
| 10% | 948 | 1,990 | 547 | 5,956 |
| 20% | 249 | 547 | 149 | 1,749 |
| 30% | 116 | 267 | 72 | 903 |
Halving the lift quadruples the conversions
A lower-funnel campaign with a true lift of 5% needs thousands of control conversions. Most accounts do not have them inside one test window.
A small holdout is paid for in time
A 10% holdout needs about three times the total conversions of an even split. It costs fewer withheld sales per day and more days.
Count conversions, not people
A test on a rare event (a funded loan, an annual subscription) is underpowered at almost any audience size. Lewis and Rao showed this at scale: across 25 experiments with $2.8 million of spend, the median confidence interval on ROI was more than 100 percentage points wide.⁷
The platform entry requirements are the same arithmetic. Google withholds results below $5,000 of spend, or below 150 conversions in the treatment group and 65 in control; results with certainty under 90% are shown only above $5,000 and 1,000 conversions.⁶ That 65 sits next to the 30% row of the table.
Reach, and what the lift is a lift of
Suppose only 60% of the test group actually received an impression: 540,000 of 900,000. The 900 incremental conversions all came from those people, which is 0.167 percentage points per person reached. Across the whole test group it is 0.10 points.
The count of incremental conversions is the same either way, and that count, with its cost, is what the budget decision needs. What changes is the percentage: the unexposed 40% of the test group add conversions to both sides of the comparison and no effect, so the lift percentage shrinks and gets harder to detect.
Johnson, Lewis and Nubbemeyer's "ghost ads" method exists to solve exactly this, by identifying the control-group people who would have been shown the ad. They report the same precision at an order of magnitude lower cost than intent-to-treat designs.⁸ A campaign that reaches a small part of its eligible audience is a poor candidate for a platform lift test.
What each platform requires
| Meta | Google Ads, users-based | TikTok | Yandex Direct, Target Lift | |
|---|---|---|---|---|
| How to get it | Experiments, Create test, Conversion Lift. The button is disabled if the account does not qualify³ | Through a Google account representative⁵ | Through an account representative¹⁶ | Display campaigns only, enabled before the first impression⁹ |
| Entry requirement | A campaign started in the past year with at least $5,000 spend and 500 conversions; Conversions API with event match quality above 5³ | At least 1,000 conversions and a campaign budget of at least $5,000⁵ | Minimum spend varies; not published¹⁶ | 1 to 5 goals; campaign of at least 7 days⁹ |
| Split | Control is 10% of the test group in a single-cell test⁴ | Holdback from 1% to 50%⁵ | Test and control groups¹⁶ | 90% test, 10% control⁹ |
| Duration | At least 28 days recommended³ | At least 7 days, more than 14 recommended⁵ | Not published | Result about 10 days after the campaign ends⁹ |
| What is reported | Incremental conversions, cost per incremental conversion, sales lift, ROAS lift, confidence⁴ | Incremental conversions, relative lift, incremental value, incremental CPA and ROAS, intervals⁶ | Incremental conversions, absolute and relative lift, cost per incremental conversion, iROAS, confidence¹⁶ | Growth in target actions; nothing may be shown if there is no visible lift⁹ |
Meta
Multi-cell tests (two strategies, each with its own holdout) still need a Meta representative. Results can start appearing after 100 conversion events, which is a display threshold and not a sample-size recommendation.⁴
One older help page still says holdout tests in Experiments were paused in April 2021; it contradicts the current pages and looks stale. I could not confirm from documentation whether the self-serve test is available to accounts in Kazakhstan: the gating is by spend, conversions and signal quality, with no country list. Open Experiments in your account and see whether the button is active.
The requirement dropped sharply in 2025, when Google moved lift studies to a Bayesian method that uses the campaign's own history as a prior. Google's own account is that the cost of a study fell from as much as $100,000 to a $5,000 minimum.¹⁰
There is also a geography-based variant, covered below. Neither is self-serve for every account.
Yandex
Target Lift measures display campaigns. For search and performance campaigns I found no documented conversion-lift product: the A/B experiments in Direct compare campaign settings against each other, with no ad-free holdout. For those campaigns the only route is a geo test you run yourself.
When the split has to be by geography
If you cannot randomise people (no platform test for the channel, several channels at once, offline sales), you randomise places: ads run in some regions and not in others, and the difference in sales between them, adjusted for how those regions normally behave, is the lift.
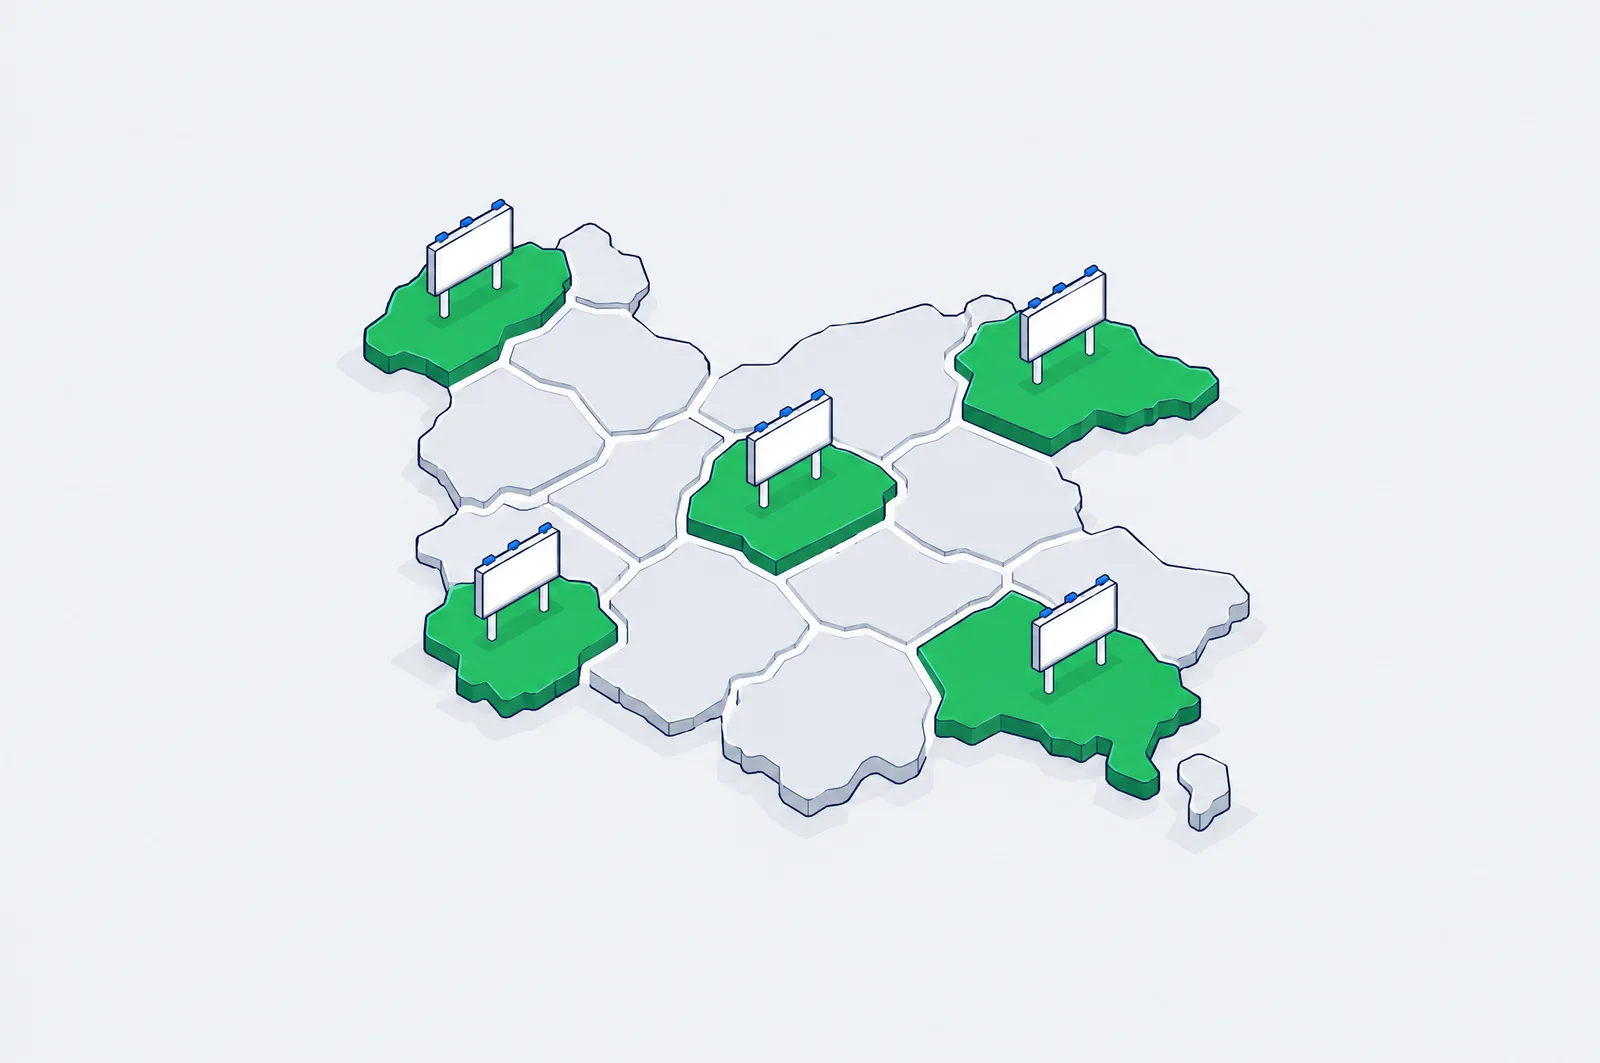

Regions with daily sales
- a pre-period at least three times as long as the test
Random assignment within strata
- large regions with large, small with small
Pre-period regression
- test regions predicted from control regions
Campaign in test regions only
Counterfactual sales
- what the test regions would have sold with no ads

Placebo test
- the same analysis on assignments where nothing ran
Google's geography-based study does this with its own geographic units, picked to limit spillover, and reports incremental ROAS with a confidence interval. It warns that the budget tends to be higher than for a users-based study and that the campaigns must target a single country.¹¹
To run one yourself there are three open tools: Google's Meridian GeoX, released in 2026 with the paper this section follows, Meta's GeoLift (synthetic control) and Google's CausalImpact (Bayesian structural time series).¹⁸ ¹² ¹³
The counterfactual
The simplest method that holds up is time-based regression. Add up daily sales across the test regions and across the control regions. On the days before the campaign, fit a line that predicts one from the other:
During the campaign the control regions keep reporting. Put their sales through the fitted line and you get the counterfactual: what the test regions would have sold with no ads. The effect is the gap between actual and counterfactual, summed over the campaign days:
Synthetic control and synthetic difference-in-differences build the same counterfactual from a weighted mix of control regions instead of their plain sum. GeoX ships all three, and in its own benchmark time-based regression on a stratified design came out best overall.¹⁸
Where geo tests go wrong: the significance test
Daily sales are not independent draws. A slow week stays slow, and every Monday resembles the Monday before. A t-test on the daily gaps counts 30 campaign days as 30 independent observations and reports far more certainty than the data holds.
The GeoX paper measures how much. In 38,400 simulated A/A experiments built on data from 192 advertisers, with no effect in any of them, the t-test produced false positives at more than ten times the nominal 5% rate.¹⁸ Its replacement is placebo inference. Re-run the whole analysis on many fake assignments, drawn by the same rule that picked the real test regions, in which nothing was advertised. Each one yields an effect that is pure noise, and the p-value is the share of them at least as extreme as the real one:
The paper recommends at least 100 placebo assignments, and divides every effect by its pre-period prediction error so that a noisy placebo group and a quiet one are compared on the same scale.¹⁸
I reproduced the comparison on a synthetic market: 20 regions, 6 of them treated, 60 days before the test and 30 days of test, with sales that share a weekly cycle and carry over from one day to the next. 1,000 tests, no effect in any of them.
| Test | False effects at a 10% threshold | At a 5% threshold |
|---|---|---|
| t-test on the daily gaps | 48.7% | 40.6% |
| Placebo test, 200 fake assignments | 10.5% | 4.3% |
The simulation is mine and its numbers describe that synthetic market, not yours. The direction is the paper's finding: on daily time series the textbook test is not a cautious approximation, it manufactures effects out of noise.
What a geo test can detect
The smallest lift a test can see follows from the standard error of the effect, and the placebo runs give you that before any money is spent:
So the power analysis is the same procedure run on last quarter's data. The better the control regions predict the test regions before the campaign, the smaller the standard error. In the paper's benchmark, drawing the placebo groups by the design's own rule instead of at random lowered the mean minimum detectable effect by 26.8%.¹⁸
On the synthetic market above the placebo test found a real 3% lift in 82.0% of runs and a 5% lift in 98.8%. Real regional sales are rougher than a simulation, so run the placebo analysis on your own history before trusting either figure.
GeoLift's guidance is a useful reality check: at least 20 geographic units, a pre-period of four to five times the test length, and at least 15 days of test on daily data.¹² The GeoX paper asks for pre-experiment data at least three times the length of the test, more if sales are seasonal.¹⁸
In Kazakhstan that is tight. The country has 20 first-level units (17 regions plus Almaty, Astana and Shymkent), and they are far from equal in size. That is the argument for stratifying: group regions with similar sales volume and seasonality and randomise inside each group, so the largest city is never set against the smallest region.¹⁸ A geo test here is feasible for a product with real regional volume. How small a lift it can see is an empirical question about your own sales history, and the placebo analysis answers it before launch. And it leaks. A person who sees the ad in a test region and buys in a control region shrinks the measured difference.¹¹
Setting it up
Tick them off as you go; the marks stay in this browser. 0 of 6 done
For the first item, the plumbing is covered in Meta CAPI and CAPIG and in connecting ads to branch sales.
Reading the result
"Lift 20%" with an interval from 13% to 27% is a finding. "Lift 20%" with an interval from -1% to 45% is a guess with a number attached.
Meta calls it "similar performance" and defines it as no significant difference.¹⁵ Google's wording for low certainty is that lift was not detected. Neither says the ads did nothing. Check the control-group conversion count against the table first.
A factor of 0.30 means ₸3,000 attributed is roughly ₸10,000 real. It applies to this campaign, this audience, this season and this spend level. Prospecting and retargeting have different factors. So do October and December.
A lift test says what the whole campaign added. It does not say what the last 20% of spend added. For that you need two spend levels as separate cells, each with its own holdout.
A lift result is the strongest input a media mix model can get. Google's Meridian documentation treats experiments as the best basis for ROI priors and warns that the experiment's time window and what it estimates may differ from the model's.¹⁷ Use it to calibrate, not to overwrite.
When not to run one
- The control group will see fewer than a hundred conversions. Use a higher-volume event closer to the top of the funnel and accept that it is a weaker proxy, or wait until volume grows.
- The campaign has no conversion to count. An awareness flight is measured with a survey: see Brand Lift studies.
- You are testing two creatives. That is an A/B test. A lift test compares ads with no ads.
- Reach is a small share of the eligible audience. The dilution above eats the signal.
The takeaway
A conversion lift test replaces "how many conversions touched an ad" with "how many would not exist without it". The answer is a ratio with an interval, and the width of that interval is set by the number of conversions in the smaller group. Size the test from that number, fix the decision rule before launch, and read the result as a range.
To check the sample size for an even split, the experiment calculator on this site uses the same two-proportion logic. For the brand side of the same campaign: Brand Lift studies and brand awareness surveys.
¹ Gordon, Moakler, Zettelmeyer (2023). Close Enough? A Large-Scale Exploration of Non-Experimental Approaches to Advertising Measurement. Marketing Science 42(4)
² Blake, Nosko, Tadelis (2015). Consumer Heterogeneity and Paid Search Effectiveness. Econometrica 83(1)
³ Meta Business Help Center: about Conversion Lift, creating a test, lift and attribution
⁴ Meta Business Help Center: Conversion Lift results
⁵ Users-based Conversion Lift - Google Ads Help
⁶ Google Ads Help: certainty of lift, Bayesian methodology for lift
⁷ Lewis, Rao (2015). The Unfavorable Economics of Measuring the Returns to Advertising. Quarterly Journal of Economics 130(4)
⁸ Johnson, Lewis, Nubbemeyer (2017). Ghost Ads: Improving the Economics of Measuring Online Ad Effectiveness. Journal of Marketing Research 54(6)
⁹ Yandex Direct Help: how Target Lift works, conditions, results
¹⁰ Marketing experimentation and incrementality testing - Think with Google, February 2026
¹¹ Google Ads Help: geography-based Conversion Lift, its results
¹² Meta Open Source: GeoLift, best practices
¹³ CausalImpact - Google
¹⁴ Meta Business Help Center, on promotions during a lift test
¹⁵ Meta Business Help Center, on test results with similar performance
¹⁶ About Conversion Lift Study - TikTok Business Help Center
¹⁷ ROI priors and calibration - Google Meridian
¹⁸ Ye, Sinn, Li, Jiao (2026). Meridian GeoX: An Open-Source Framework for Precision and Efficiency in Geo Experiments. Google, 1 September 2026. Code: github.com/google/meridian-geox
FAQ
Is a conversion lift test the same as an A/B test?
No. An A/B test compares two versions of an ad or a page. A lift test compares ads with no ads: one random group is eligible for the campaign and the other is held out.
Why does the lift test show fewer conversions than Ads Manager?
Attribution counts conversions that followed an ad. A lift test counts the conversions that would not have happened without the ads, by subtracting what the control group did anyway. The second number is usually smaller.
How big should the holdout be?
Big enough to collect the control-group conversions the test needs. To detect a 10% lift you need about 547 control conversions with a 10% holdout, or 948 in each group with an even split. A larger holdout shortens the test and withholds more sales per day.
What is a good incrementality factor?
There is no universal benchmark. In a study of 663 Facebook experiments the median experimental lift was 29% for upper-funnel, 18% for mid-funnel and 5% for lower-funnel outcomes, and standard observational methods overstated all three. Measure your own, per campaign type.
Can I run a conversion lift test in Yandex Direct?
Only for display campaigns, through Target Lift, which uses a 90/10 split. For search and performance campaigns there is no documented ad-free holdout, so the option is a geo test you run yourself. Checked on 5 October 2026.
Seeing this in your own funnel?
Two weeks, fixed scope, read-only access. You get the findings and a 90-day roadmap whether or not we work together afterwards.