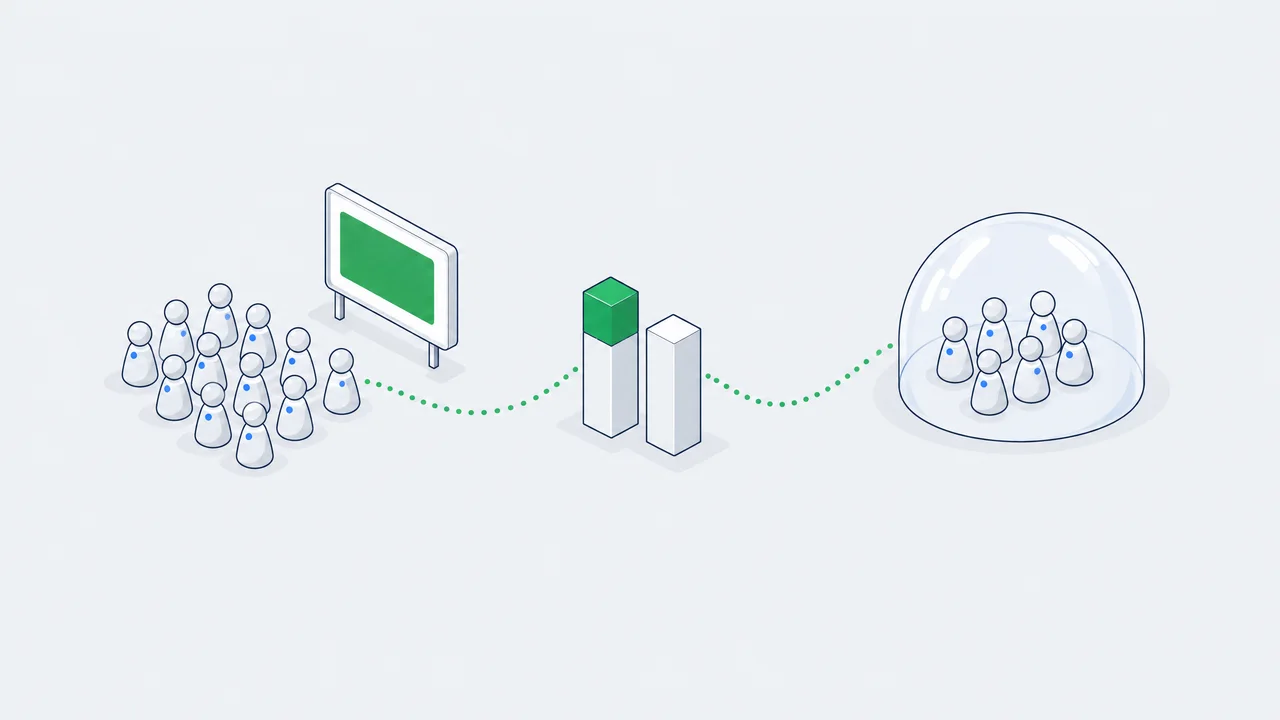
A Brand Lift study is the one number in an awareness report that comes from an experiment instead of a delivery log. The platform holds the ad back from a random part of your audience, surveys both groups, and reports the difference. The answer is narrow: did people who could see the ad answer one survey question differently from people who could not.
Narrow is fine. The trouble starts when the result gets read. "+13% brand lift" and "+4 points" can be the same study, "no lift detected" usually means "too few answers" and not "the ad did nothing", and a lift found in one age bracket out of eighteen cuts is more likely noise than insight.
Every platform requirement below was checked on 5 October 2026 against the vendor's own help pages. They change; re-check before you plan.
What the study actually is
Three steps, and only the first one is unusual: a holdout, one survey for both groups, a subtraction.

Eligible audience
- everyone the campaign is allowed to reach
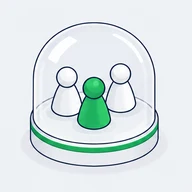
Holdout, drawn at random
- set aside before the first impression and never served the ad
One survey question for both groups
- same wording, same placement: "Which of these brands have you heard of?"
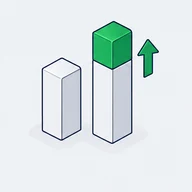
Lift
- share of positive answers among the exposed minus the share in the holdout
Because the split is random, the two groups differ only in whether the ad was allowed to reach them. That is what separates a Brand Lift study from a before/after survey, where the season, a competitor's launch and your own PR all move the number along with the ad.
Google Ads and YouTube
The control group is people who were eligible for the ad and were not shown it.²
Meta
A sample of the eligible audience is split at random into test and holdout. In a single-cell test the holdout is 10% of the size of the test group and is scaled up in reporting.⁵
Yandex Direct
More than 10,000 users are invited, half test and half control. The control is built with a "virtual auction": those people won the auction for your ad and saw the survey instead.⁹
TikTok
Two randomised groups, exposed and control, drawn from part of the target audience and measured by an in-feed poll.⁸
Five numbers from one experiment
Every platform reports some subset of the same five figures. They all come from two proportions: the positive response rate in the exposed group, written pe below, and the same rate in the control group, pc. Google calls the second one the baseline.
Absolute lift is a difference in percentage points. Relative lift divides it by the baseline. Headroom lift divides it by the people who were still there to be won: everyone who did not already answer positively. These are Google's definitions.³ Yandex uses the same absolute and relative formulas and calls lifted users "uplift reach".¹⁰ Meta reports the point difference as "brand lift percent" and the head count as "brand lift".⁶
A worked example. The numbers are illustrative, chosen to be easy to check:
- Campaign reach: 1,200,000 people. Spend: ₸6,000,000.
- Question: "Which of these brands have you heard of?"
- Control group: 2,000 responses, 600 positive. Baseline rate 30.0%.
- Exposed group: 2,000 responses, 680 positive. Exposed rate 34.0%.
| Metric | Arithmetic | Result |
|---|---|---|
| Absolute lift | 34.0% - 30.0% | 4.0 points |
| Relative lift | 4.0 / 30.0 | 13.3% |
| Headroom lift | 4.0 / 70.0 | 5.7% |
| Lifted users | 4.0% × 1,200,000 | 48,000 |
| Cost per lifted user | ₸6,000,000 / 48,000 | ₸125 |
Three "lifts" - 4.0, 13.3 and 5.7 - describe one result. Whoever writes the report picks the one that looks best, so decide which one you read before you open it.
How sure is it
The 4.0 points came from 4,000 people, not from 1,200,000. Ask another 4,000 and you get a slightly different number. The standard error of the difference says how different:
With the numbers above, SE = 1.47 points. Google's reports use an 80% two-sided interval, which it explains as a 90% chance that the true lift is above the lower bound.³ That interval is the lift plus or minus 1.2816 standard errors:
- Lift: 4.0 points, interval from 2.1 to 5.9.
- Lifted users: 48,000, interval from 25,335 to 70,665.
- Cost per lifted user: ₸125, anywhere from ₸85 to ₸237.
Google also shows a "certainty", defined as one minus the p-value.³ Here the z-score is 2.71 and the certainty, a one-sided figure that agrees with the lower bound of that interval, is 99.7%. Meta reports a confidence percentage and treats a result above 90% as reliable.⁶
Now keep the same rates and cut the sample to 400 responses per group: 136 of 400 against 120 of 400. The lift is still 4.0 points. The standard error is 3.30 points, the interval runs from -0.2 to 8.2, and the certainty is 88.8%. The interval includes zero, so the platform prints "No lift detected".
Same creative, same media, same real effect. The only thing that changed is how many people answered. Google draws the line itself: "Not enough data" when responses are below the minimum, "No lift detected" when there were enough responses and no statistically significant difference.³ Neither status says the lift was zero.
Put your own report through the same arithmetic:
Brand lift calculator
Starts with the worked example. Replace the numbers with the ones from your report.
Lift detected. There is a 90% chance the true lift is above 2.1 points.
How many responses a study needs
You can work out the required sample before launch. For a one-sided 90% test with 80% power (zα = 1.2816, zβ = 0.8416), the responses needed in each group are:
At a 30% baseline:
| Lift you want to detect | Responses per group | Responses in total |
|---|---|---|
| 1 point | 19,111 | 38,222 |
| 2 points | 4,821 | 9,642 |
| 3 points | 2,161 | 4,322 |
| 4 points | 1,226 | 2,452 |
| 5 points | 791 | 1,582 |
Halving the lift you want to see quadruples the sample. That is why small flights come back empty.
The curves are the formula. The dots check it against 2,000 simulated studies at each sample size, with the lift really there: at 1,226 responses per group 81.8% of them detected the 4-point lift, and at 4,821 per group 79.6% detected the 2-point one. Both sit on the 80% the formula promises.
Google's own planning figures are in the same range. Google Ads Help says a strong campaign needs about 2,000 responses per metric, a campaign at the recommended minimum budget about 4,100, and that if nothing shows after 16,800 the lift may be undetectable.³ The Display & Video 360 table gives 1,200 to 2,800 responses for a lift above 4 points, 5,000 to 11,000 for 2 points and 20,000 to 45,000 for 1 point.⁴
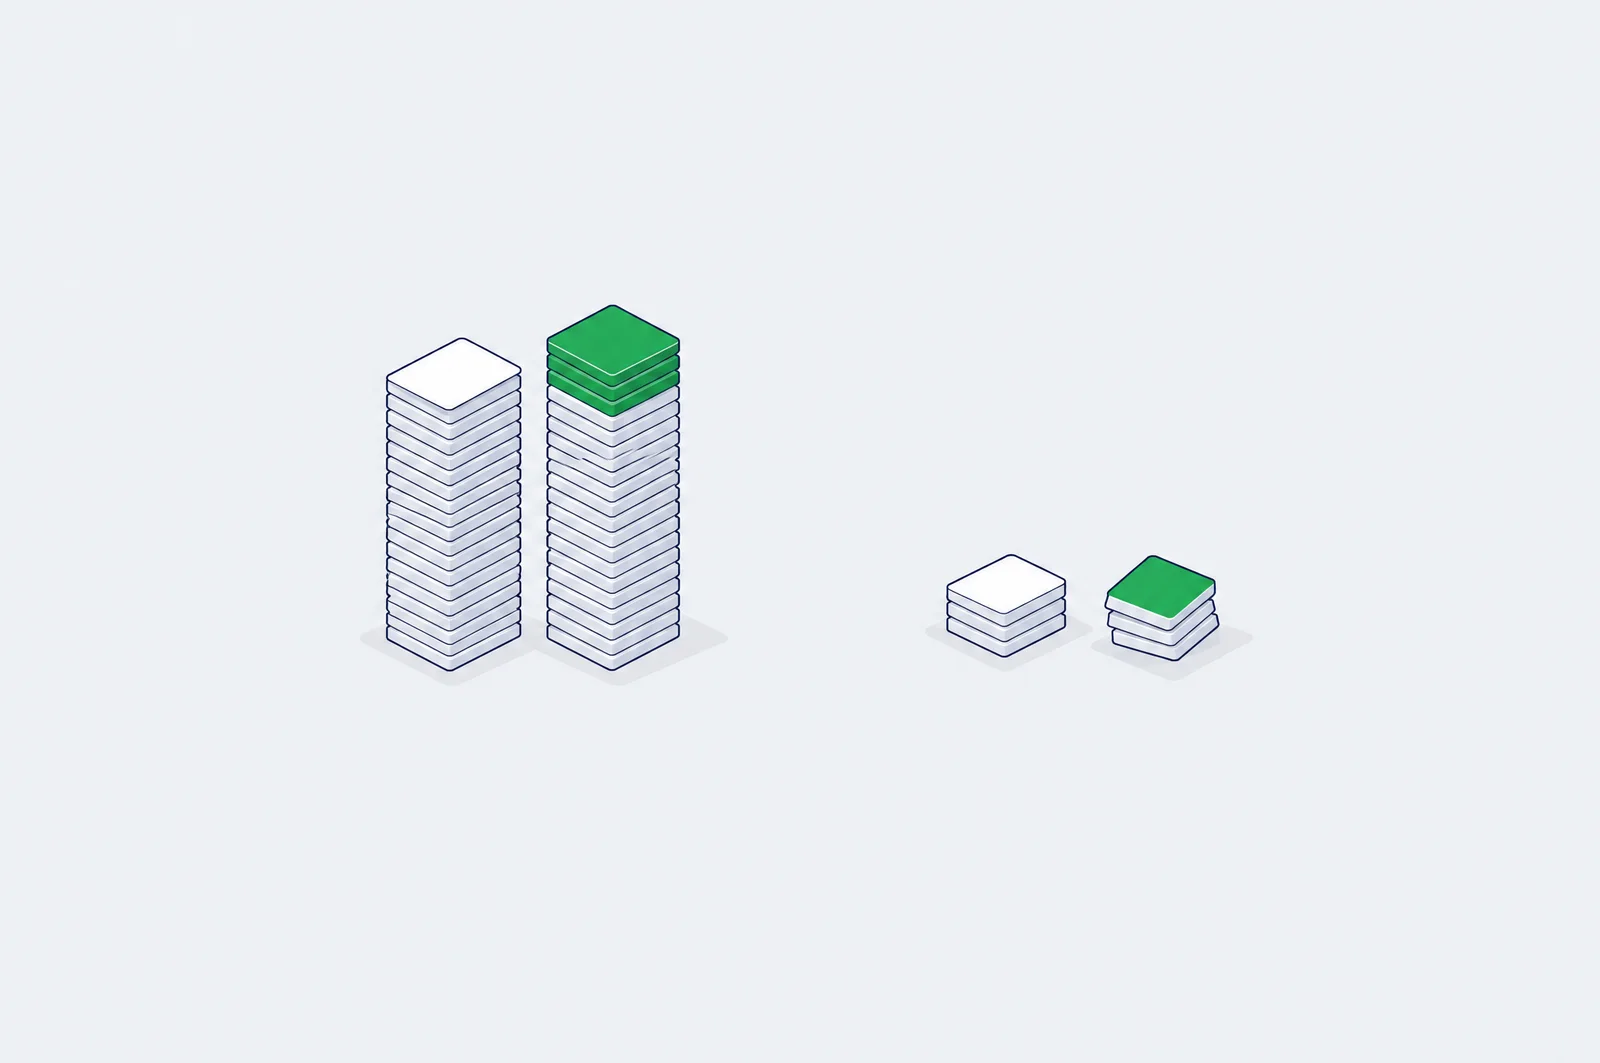
Responses are bought with reach, and reach with budget. This is where the platform minimums come from, and it is why every extra question costs more: each question needs its own responses.
A study with no lift in it
A test earns trust by staying quiet when nothing happened. The way to check that is the one Google's measurement team applies to its own geo-experiment framework: run the analysis many times on data where the true effect is zero and look at the p-values. With no effect they should be spread evenly between 0 and 1, so a 10% threshold is crossed 10% of the time.¹²
I ran that check on the test from this article: 4,000 simulated studies in which both groups answer "yes" at 30.0%, with 143 responses arriving per group per day for 14 days.
| How the study is read | Studies that show a lift | What it should be |
|---|---|---|
| Once, on day 14 | 10.2% | 10% |
| Every day from day 2, stopping at the first "lift" | 29.4% | 10% |
Read once, the test is wrong as often as a one-sided 90% test is allowed to be. Read daily, the same test on the same data nearly triples its false lifts, and nothing about the campaign changed. Thirteen looks at accumulating answers are thirteen chances for noise to cross the line, and in the first days the measured figure sits far from zero even where there is no lift at all.
Fix the day you will read the study before it starts, and read it then. The same arithmetic applies to slices: every extra look and every extra cut is another draw from the same noise.
What each platform requires
| Google Ads / YouTube | Meta | TikTok | Yandex Direct | |
|---|---|---|---|---|
| How to get it | Through a Google account representative¹ | Brand survey test in Experiments, or a managed study through a Meta representative; certain regions only⁷ | Through an account manager only⁸ | In the settings of a media campaign⁹ |
| Minimum budget | Kazakhstan is in the lowest tier: $5,000 for 1 question, $10,000 for 2, $20,000 for 3, spent within the first 10 days¹ | By country. Kazakhstan is not on the list; the default for unlisted countries is $15,000⁵ | Not published | ₸4,000,000 for the period and ₸285,500 per day before VAT, reach of at least 3 million users⁹ |
| Questions | Up to 3: ad recall, awareness, association, consideration, favorability, purchase intent, custom¹ | Up to 3. Ad recall is mandatory; plus awareness, favorability, familiarity, recommendation⁷ | Not published in the help centre | 3 of 6: awareness, ad recall, purchase intent, consideration, favorability, ad message recall⁹ |
| Duration | Standard study completes in 3 to 14 days¹ | At least 2 weeks, up to 90 days⁷ | Not published | At least 14 full days; 2 to 4 weeks recommended⁹ |
| How certainty is shown | Certainty = 1 - p-value; 80% interval³ | Confidence percentage; above 90% counts as reliable⁶ | Not published | No confidence level stated¹⁰ |
The budget is the sum across all campaigns in the study and is converted to the account currency. If an earlier study ended in "No lift" or "Not enough data", Google offers an Enhanced study: three times the minimum budget, 9 to 14 days, roughly three times the surveys.¹
Meta
I could not confirm from Meta's documentation whether a brand survey test can be created for an account or audience in Kazakhstan: the help centre says availability is regional and does not publish the list. Check Experiments in your own account or ask your Meta representative.
The survey runs in one language. Kazakh was not on the list of supported languages when I checked, Russian was.⁷ A Russian-only poll in Kazakhstan measures the Russian-reading part of your audience.
TikTok
The help page says to include all active campaigns so the control group stays clean.⁸ Budget thresholds are not published. Numbers quoted in blogs range from $25,000 to six figures and none of them trace to TikTok.
Yandex
The tenge threshold is not a conversion of the rouble one (2,000,000 RUB for the period), so read your own currency row. The conditions changed on 12 January 2026 and older articles still quote half these amounts.
A separate Top of Mind variant with an open question costs far more: ₸33,210,000 for the period and reach of at least 6 million.⁹
Setting it up
The order matters, because most of these cannot be fixed after launch. Tick them off as you go; the marks stay in this browser. 0 of 7 done
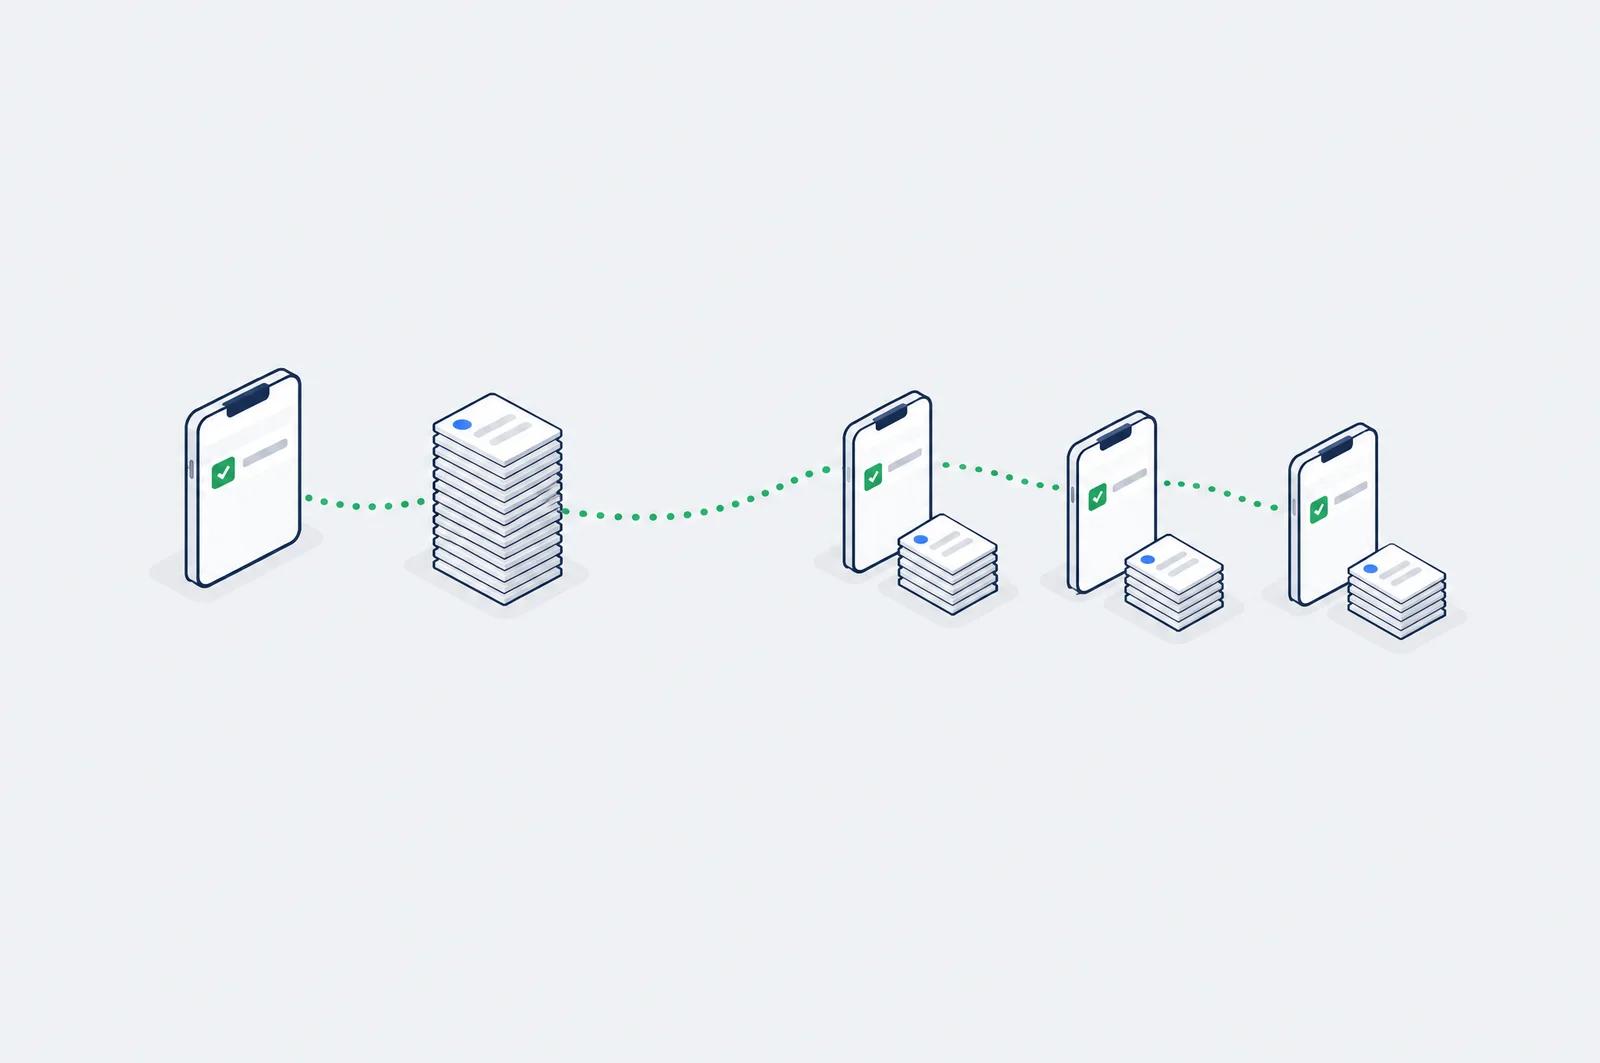
Where the reading goes wrong
The same 2-point lift, three brands:
| Baseline | Absolute lift | Relative lift | Headroom lift |
|---|---|---|---|
| 5% | 2 points | 40.0% | 2.1% |
| 30% | 2 points | 6.7% | 2.9% |
| 60% | 2 points | 3.3% | 5.0% |
A new brand with 5% awareness reports "+40%" for the same 2 points that a market leader reports as "+3.3%". Neither number is wrong. They are not comparable, and a benchmark deck that mixes them compares nothing. For a small brand read absolute lift. For a brand near the ceiling read headroom lift.
A report cut by 6 age-and-gender groups and 3 creatives has 18 cuts. At 90% confidence, with no real effect anywhere, expect 1.8 of them to show a "significant" lift by chance. The probability that at least one does is 85%.
A lift in one segment is a hypothesis for the next flight
Ad recall asks whether the person remembers seeing the ad. It is the easiest question to move and the least connected to the brand.
Report it as ad recall
The "estimated ad recall lift (people)" column in Meta Ads Manager is a model calibrated with polls. Meta labels it as estimated and says a brand lift test is what you need for the most accurate measurement.⁶ It has no holdout.
Not a study, do not present it as one
Different questions, different audiences, different survey placements.
Compare two flights on one platform with one question
I looked for a published norm by question and did not find one with a traceable sample. Kantar's figures quoted by WARC put display at +2.7 points of aided awareness and video with banners at +4.8, without the size of the database.¹¹
Treat "4 to 8 points is normal" as unsourced until someone shows the source
When a Brand Lift study is the wrong tool
- The budget is under the threshold. A YouTube flight that spends less than $5,000 in its first ten days does not qualify for a Google study. The alternative is your own survey with a control cell, which is a different method with its own arithmetic: see measuring brand awareness with top-of-mind, spontaneous and aided questions.
- The campaign is meant to sell. A survey answer is not a purchase. For a campaign that should produce applications or orders, hold out conversions, not opinions: see conversion lift.
- You want a trend. A study covers one flight. Awareness over a year is a tracker.
- The audience is tiny. A B2B campaign to a few thousand decision-makers cannot produce 2,000 survey responses per group. No platform setting changes that.
The takeaway
A Brand Lift study is a small randomised survey attached to your flight. Its output is one difference between two proportions, with an interval around it. Read the absolute lift and the interval. Check the number of responses before believing "no lift". Ask one question, and decide in advance which result changes the next plan.
To size a study before asking your account manager for one, the logic is the same as for any A/B test: the experiment calculator on this site uses the same two-proportion formula.
¹ Set up Brand Lift - Google Ads Help
² About Brand Lift - Google Ads Help
³ Understand your Brand Lift measurement data - Google Ads Help
⁴ Brand Lift in Display & Video 360 - Display & Video 360 Help
⁵ Meta Business Help Center: minimum budgets for brand survey tests, how holdouts work
⁶ Meta Business Help Center: brand survey test results, estimated ad recall lift
⁷ Meta Business Help Center: about brand survey tests, poll questions, best practices
⁸ TikTok Brand Lift Studies - TikTok Business Help Center
⁹ Yandex Direct Help: Brand Lift conditions, how it works
¹⁰ Brand Lift results - Yandex Direct Help
¹¹ The digital brand effect - WARC, 19 March 2020
¹² Ye, Sinn, Li, Jiao (2026). Meridian GeoX: An Open-Source Framework for Precision and Efficiency in Geo Experiments. Google, 1 September 2026
FAQ
Can a small campaign run a Brand Lift study?
Only if it clears the platform minimum. On YouTube a campaign targeting Kazakhstan needs $5,000 of spend in the first 10 days for one question, $10,000 for two and $20,000 for three. Yandex Direct asks for ₸4,000,000 over the period and a reach of 3 million users. Below that, run your own survey with a control region. Thresholds checked on 5 October 2026.
Why does one platform show a lift and another does not for the same campaign?
They are different experiments: different questions, different audiences, different survey placements and different numbers of responses. A platform with fewer responses will print "no lift detected" for the same real effect. Compare flights within one platform, not platforms with each other.
Is "estimated ad recall lift" in Meta Ads Manager a Brand Lift study?
No. It is a modelled estimate calibrated with polls and has no holdout group. Meta's own documentation says a brand lift test is needed for the most accurate ad recall measurement.
How long does a study take?
A standard Google study completes in 3 to 14 days. Meta recommends at least two weeks and allows up to 90 days. Yandex requires at least 14 full days and recommends two to four weeks.
Does a positive Brand Lift result mean the campaign increased sales?
No. It means more people in the exposed group gave the positive survey answer. Whether that turned into sales is a separate question, answered by a conversion lift test or a geo experiment.
Seeing this in your own funnel?
Two weeks, fixed scope, read-only access. You get the findings and a 90-day roadmap whether or not we work together afterwards.