The manager who runs an online coffee shop's Instagram sends the owner a summary of the first week of October: "Best post is the meme, 'Monday without coffee': 1,900 likes, ER 25.9%. The grinding guide did worse, 380 likes." The owner replies: "More memes, then." But the guide has 610 saves against the meme's 40 and almost five times as many clicks through to the website. To tell who is right, you need to know what exactly was counted, and to compare posts by their job.
These are the same posts we used for social media algorithms, and the numbers are illustrative.
What Instagram counts
Start by agreeing on the words. Instagram insights give a post these metrics (about Instagram insights):
| Metric | What it counts |
|---|---|
| Views | How many times the post was shown on screen or played. For Reels every start counts, replays included |
| Viewers | How many unique accounts saw the post at least once. Instagram calls the metric estimated and still in development |
| Interactions | How many actions people took: likes, comments, saves, shares |
| Accounts engaged | How many unique accounts took at least one action |
| Profile activity | What people did on the profile after arriving from the post |
| Average watch time | For Reels: total watch time divided by the number of first plays in a session |
The last two rows are described in the help pages on insights for posts and Reels.
Views replaced impressions only recently. In Meta's API the views metric arrived in version 22.0 in January 2025, and the old impressions and plays were deprecated for all versions from 21 April 2025 (v22.0 changelog). If an old report or an analytics tool shows impressions, do not put them in the same row as today's views. And if a contractor writes "reach", ask what they mean: in Instagram insights today, unique accounts are counted by Viewers.
Other platforms have their own definitions. Telegram itself calls a post's view counter approximate: it includes views of forwarded copies, and someone who comes back to the post a few days later is counted again. TikTok's help page on analytics in TikTok Studio warns that data can arrive late and suggests waiting a few days. YouTube has counted a Shorts view on every start and replay since 31 March 2025 (about Shorts). Views from the three platforms do not go into one total.
ER: you choose the denominator
ER (engagement rate) is not a platform metric: Instagram insights do not show it, and there is no single formula. Each report divides interactions by its own number: viewers, followers or views. One post, different percentages.
The picture shows this with round numbers. What it calls reach is what Instagram insights now call Viewers.
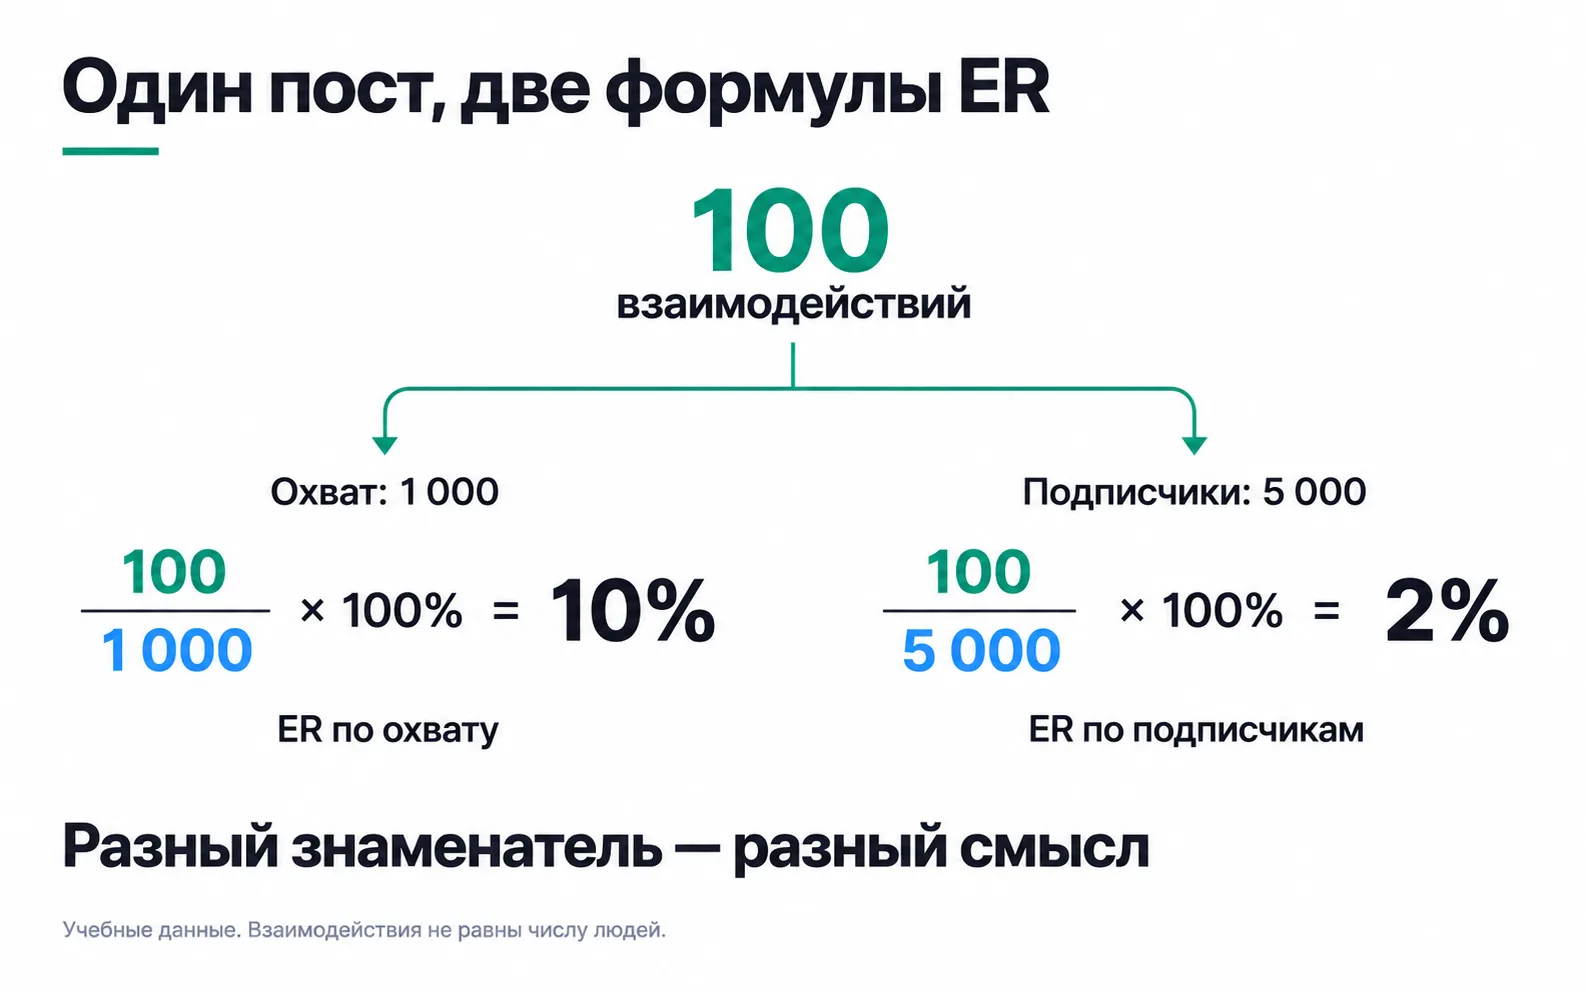
The shop has 9,000 followers, and in the seven days after posting the three posts got this:
| Photo "Roast of the week" | Reel "Grinding for a cezve" | Reel "Monday without coffee" | |
|---|---|---|---|
| Views | 2,300 | 15,000 | 21,000 |
| Viewers | 1,800 | 11,200 | 17,500 |
| Interactions | 167 | 1,244 | 2,335 |
| ER by viewers | 9.3% | 11.1% | 13.3% |
| ER by followers | 1.9% | 13.8% | 25.9% |
| ER by views | 7.3% | 8.3% | 11.1% |
The meme's 25.9% is ER by followers. But the Reel was also watched by people who do not follow the shop: 17,500 viewers, almost twice the number of followers. Dividing their actions by followers is like working out a response rate from a list the respondents were never on. For Reels the denominator is viewers, and then the meme gives 13.3% and the guide 11.1%: the gap is no longer twofold. At most 1,800 of the 9,000 followers saw the photo, so its ER by followers is five times lower: the denominator includes at least 7,200 people who never saw the post.
The second trap: interactions count actions, not people. One person can save a video, like it and forward it. The guide has 1,244 interactions and 820 accounts engaged. If the question is "what share of viewers did anything at all", you count accounts engaged: 820 / 11,200 = 7.3%.
Whichever formula you choose, write it next to the number: "ER = interactions / viewers, 7 days after posting". Then figures from two reports can be compared, and nobody will set 25.9% and 11.1% from different formulas side by side.
Compare a post with its job
Let us break the meme and the guide down by action. The shop counts clicks through to the website from the link it puts in stories with the video on the day it goes out, tagged by the rule from SMM strategy. The guide has utm_campaign=reorder and utm_content=brew_guide_turka. The meme was posted outside the series to show the shop to new people, so it has utm_campaign=first_order and utm_content=meme_monday.
| Guide "Grinding for a cezve" | Meme "Monday without coffee" | |
|---|---|---|
| Likes | 380 | 1,900 |
| Comments | 24 | 85 |
| Saves | 610 | 40 |
| Shares | 230 | 310 |
| Follows after watching | 60 | 45 |
| Clicks to the website from the story link | 140 | 30 |
| Orders through those links in 7 days | 5, of them 3 second orders | 0 |
On likes the meme won five to one. But a like is one form of reaction, not a measure of a post's value, and these two videos have different jobs. The meme is meant to show the shop to new people, so you measure it by viewers and follows after watching. The guide is meant to help a buyer brew a good cup and order again, so you measure it by saves, clicks and orders.
At its own job the meme did so-so: 17,500 viewers but 45 follows, fewer than the guide got. The guide did better at its job: 610 people saved it for later, and it brought 140 clicks to the website.
A save is still not a sale. 610 people saved the guide, and there were five orders through the link. How many people will order in a month, when their beans run out, will never show up in Instagram insights. Some of those orders will come through the tagged link and show up in the CRM, and some will come without a tag. And five orders against none is too little to judge how much money the guides bring in: the gap rests on five purchases, and one or two chance ones would shift it noticeably. It is safer to compare series over a month: add up all the guides and all the memes and look at second orders by tag.
The report for the owner: one row per post
A report you can make decisions from starts with the job. One row per post:
| Post | Job | Job metric | Result for the week | What we do |
|---|---|---|---|---|
| Guide "Grinding for a cezve" | Help people brew and order again | Saves, clicks and orders through utm_content=brew_guide_turka | 610 saves, 140 clicks, 5 orders | Film the same for a moka pot and an espresso machine |
| Meme "Monday without coffee" | Show the shop to new people | Viewers, follows after watching | 17,500 viewers, 45 follows | No more than once a week, until we see whether new followers order |
| Photo "Roast of the week" | Remind followers to order | Clicks and orders through the story link | 60 clicks, 2 orders | Keep it, but post on the day the roast comes out |
ER can stay in a report like this as the last column, with the formula in the header. Decisions are made from the Job metric column.
Exercise: a job-based report for your account
If every post's job is "engagement", none of them had a job, and the report will come down to likes. A post's job shows in what a person is meant to do after it: follow, save, click, message you.
Posts with different jobs do not go into one ranking. A meme with a high ER and a guide with a low one can both be successes, each in its own row.
When each post has one or two leads on its job metric, you decide nothing from a single post. The rule is the same as for creatives: a difference should not rest on one or two results, so posts in one series are added up over a month. And if the What we do column says "continue" everywhere, the report decided nothing: find the row where the result is furthest from the job and write down what you will change in it.
Video: ways of calculating ER
Whichever formula you use, write the denominator next to the number.