
If your analysts work in Python and you have at least two years of weekly spend and KPI data by region, start with Google's Meridian. If you need a structure Meridian does not offer, such as your own pooling across regions, media effects that change over time or lift tests entered as data, use PyMC-Marketing. Meta's Robyn still gets an R team to a national model fastest, but its main branch has had no commits since 27 June 2025, so treat it as frozen software. If nobody on the team can own priors and diagnostics, none of the three is the right choice: buy a managed service and keep one person who can challenge it.
This article compares frameworks. If you need the basics first (adstock, saturation, average against marginal ROI), start with what marketing mix modeling is; a step-by-step walk through Meridian is in a separate guide.
The short answer by situation
The cards are my recommendations, built on the facts in the rest of the article. They are judgement, not a ranking.
- Python team, regional data. Meridian. Weekly spend and KPI by region for 2+ years, media weighted toward Google, plans to run geo experiments. You get a geo-hierarchical Bayesian model, priors on ROI and a direct path from Meridian GeoX results into those priors. Plan for a GPU.
- R team, national data, deadline. Robyn, pinned. The automated hyperparameter search produces a set of candidate national models without writing priors. Pin CRAN 3.12.1 in a container: there have been no commits on main since June 2025, so nobody will fix what breaks.
- Custom Bayesian modelling. PyMC-Marketing. You want to choose the pooling across regions yourself, let media effects drift over time, use a delayed-peak adstock or feed lift tests into the likelihood. Needs someone fluent in PyMC.
- No data science team. Managed vendor. Each of the three needs an owner for data, priors, diagnostics and refreshes. Without one, buy the service and keep the data pipeline and the experiment log in house.
- Still on LightweightMMM. Migrate. The repository is archived and Google says it is no longer supported. Meridian is Google's successor; PyMC-Marketing is the alternative if you want to stay close to the code.
Why does "media weighted toward Google" point to Meridian when the model itself is channel-agnostic? The advantage is the ecosystem around it: GeoX designs geo experiments whose results feed straight into Meridian's priors, the Scenario Planner gives marketers a no-code view of budget scenarios, and Google runs a programme of certified Meridian partners.¹ None of that changes the maths. It changes how much help you can get.
Where the three stand as of October 2026
- 2.1.0: Meridian, released 17 Sep 2026
- 1.2.0: PyMC-Marketing, released 29 Sep 2026
- 3.12.1: Robyn on CRAN, released 2 Jul 2025
- 15 months: without a commit on Robyn's main branch (27 Jun 2025 to 5 Oct 2026)
| Meridian | Robyn | PyMC-Marketing | LightweightMMM | |
|---|---|---|---|---|
| Maintainer | Meta Marketing Science | PyMC Labs | ||
| Latest version | 2.1.0 | 3.12.1 on CRAN | 1.2.0 | none, archived |
| Released | 17 Sep 2026 (PyPI 25 Sep 2026) | 2 Jul 2025; last GitHub tag v3.12.0, 19 Dec 2024 | 29 Sep 2026 | n/a |
| Licence | Apache-2.0 | MIT | Apache-2.0 | n/a |
| Language | Python 3.11-3.13 | R; the Python port robynpy 0.3.6 is a beta | Python 3.12 or newer | Python |
| Maintenance signal | 2.0.0 and 2.1.0 shipped two weeks apart in September 2026 | No commits on main since 27 Jun 2025; no deprecation notice | 1.0.0, 1.1.0 and 1.2.0 shipped in August and September 2026 | Repository archived, no longer supported |
Meridian 2.0.0 (2 September 2026) switched the default computation backend from TensorFlow to JAX and added prior calibration through incrementality experiments such as Meridian GeoX; 2.1.0 (17 September) added a declarative vocabulary to the model specification, with date ranges, calibration specs and holdout specs as named objects.² PyMC-Marketing 1.0.0 (7 August 2026) was announced as the stable API, moved to PyMC 6 and made the multidimensional model the default MMM class;³ 1.2.0 followed on 29 September.⁴
Robyn is the awkward case. CRAN 3.12.1 dates from 2 July 2025,⁵ the last tagged GitHub release is v3.12.0 from December 2024, and the main branch has had no commits since 27 June 2025 while users keep opening issues in 2026.⁶ There is no deprecation notice, so "frozen" is my reading of the activity, not an announcement. The Python port robynpy calls itself an "LLM-translated Beta" and was translated from R 3.11.1.⁷ Frozen software keeps working until a dependency moves, and Robyn sits on glmnet, Prophet, nloptr and reticulate in R plus Nevergrad in Python. If you choose it, freeze the whole environment in a container.
LightweightMMM, Google's earlier Bayesian MMM, is archived: its README says Google released Meridian on 29 January 2025 and LightweightMMM is no longer supported.⁸ If you still run it, plan the migration now.
Two ways to estimate the same model
All three frameworks fit the same skeleton: KPI equals baseline plus transformed media plus controls plus noise. They differ in how they pick the parameters and in what "uncertainty" means, and that difference shapes every ROI number you will present.
Robyn: ridge regression inside a multi-objective search
Robyn fits an additive linear model:⁹
Here is the KPI in week t, the adstocked spend of channel j, its Hill saturation curve and its coefficient, kept non-negative for paid media; are Prophet components (trend, season, holidays) and other context variables with coefficients ; is noise.
For a given set of transformations, the coefficients come from glmnet with its mixing parameter alpha set to 0, which is pure ridge regression:⁶
N is the number of weeks in the training window, the transformed regressor and the penalty strength. The penalty shrinks coefficients toward zero, so correlated channels cannot take extreme values. Robyn's docs point out that ridge is equivalent to a Bayesian regression with a Gaussian prior on the coefficients. The difference from the Bayesian tools is that this prior is implied by rather than written down, and you never see its shape.
The ridge fit is the inner loop. The outer loop is Nevergrad, Meta's gradient-free optimiser, which proposes the transformation hyperparameters: for each channel the adstock decay (or two Weibull parameters) and the two Hill parameters, plus and the share of data used for training. Ten channels with geometric adstock already mean 32 hyperparameters. The docs ask for at least 2,000 iterations and 5 trials.⁹ Each candidate is scored on two objectives, three when you calibrate with experiments:
NRMSE is the prediction error: root mean squared error divided by the range of the KPI. With time-series validation switched on, the code scores the validation period.
DECOMP.RSSD, which Robyn calls the business error, compares , channel j's share of the total effect of paid media, with , its share of paid spend, over the set of paid channels . By default the value is also multiplied by one plus the share of paid channels with zero effect, which penalises models that switch channels off.
MAPE.LIFT exists only when you calibrate: is the incremental result of experiment m and the model's contribution of the tested channel over the same dates.
Robyn then keeps the models that no other model beats on NRMSE and DECOMP.RSSD at once, the Pareto front. With calibration it first keeps only the 10% of models with the lowest MAPE.LIFT. It clusters the candidates with k-means, picks one winner per cluster and attaches a bootstrap 95% interval to each channel's ROAS within the cluster. The output is a handful of plausible models, and choosing among them is your job.
Why DECOMP.RSSD is controversial
Imagine the search drives DECOMP.RSSD all the way to zero, so for every channel. With the effect of channel j, its total spend and E, C the totals over paid channels:
Every channel then has the same ROAS, the portfolio average. Real runs never reach zero, but the pressure always points that way: a channel with 30% of paid spend is pulled toward 30% of the paid effect, whatever the data say. Robyn's own documentation calls the metric controversial "because of the convergence of media ROAS".⁹
The defence is fair: an unpenalised regression on correlated channels can hand the whole effect to one of them, and DECOMP.RSSD rules out such extreme decompositions. For you it has three practical consequences:
- Real winners and real losers are pulled toward the average, so the differences between channels look smaller than they are.
- The budget allocator works on those compressed curves, so its recommended shifts are more timid than the data alone would support.
- A channel that genuinely does nothing is hard to detect, because the zero-effect penalty works against it.
My reading is that DECOMP.RSSD acts as a prior that all channels are equally efficient, applied across the whole search and never written down. Since v3.10.5 you can weight the objectives, and calibrating with experiments through MAPE.LIFT is the real counterweight.
Meridian and PyMC-Marketing: prior times likelihood
Both are Bayesian. Instead of searching for one best point, they describe every parameter with a probability distribution:
stands for all model parameters, is the prior (what you believe before seeing the data), the likelihood (how probable the observed KPI is for given parameters) and the posterior. Both tools sample the posterior with NUTS, the No-U-Turn Sampler, so every output, from a channel's ROI to an optimal budget, comes with a credible interval: the range that holds, say, 90% of the posterior probability. Meridian reports 90% intervals by default.
Meridian's core equation, with the organic, non-media and reach-and-frequency blocks left out:¹⁰
g is the region, t the week, the shared time effect, the region intercept, z the controls with coefficients , x the media of channel i with decay (the docs call it ), half-saturation and slope , L the maximum lag and the effect of channel i in region g. Regions share a channel's adstock and Hill parameters but get their own effect, drawn around a channel-level value:
is the channel's typical log effect and how far regions may deviate from it. This is partial pooling: small regions borrow strength from large ones.
The distinctive part is where the prior sits. By default Meridian places it on ROI rather than on , and derives the coefficient from it:¹¹
is the incremental outcome of channel i and its cost. The default prior has a median of and a mean of , and its central 95% interval, , runs from about 0.21 to 7.1. A marketing lead can discuss an ROI range; nobody can discuss a coefficient on per-capita, median-scaled media. That is what makes experiments easy to bring in, as the calibration section shows. The other prior types are marginal ROI, contribution share and the raw coefficient.
PyMC-Marketing writes the same skeleton for one series or for any set of dimensions such as region:¹²
is channel m's adstock and saturation transform, are controls, Fourier seasonality and event terms, the channel coefficient and the noise scale. By default the priors sit on coefficients on max-abs scaled data, for example Normal(0, 2) for the intercept and the controls, and every prior, the likelihood included, can be replaced. Since 1.0.0 the library also offers multiplicative (log and log-log) models.³
What the difference means for you
- With Robyn you choose among models. The assumptions live in the hyperparameter bounds, the ridge penalty and DECOMP.RSSD, and the uncertainty you see is a bootstrap inside a cluster plus the spread across the Pareto front, not a posterior.
- With Meridian or PyMC-Marketing you get one model with explicit priors and an interval on every number. When the data are weak, the posterior stays close to the prior, so always compare the two; Meridian's health checks do it for you.
- Neither approach escapes the core problem. Chan and Perry at Google showed five models with R² of 0.98-0.99 and MAPE of 6-8% whose sales predictions differed by up to 50% and whose budget recommendations conflicted.¹³ Good fit does not prove the decomposition. Experiments break the tie.
Adstock and saturation, side by side
| Meridian | Robyn | PyMC-Marketing | |
|---|---|---|---|
| Adstock shapes | Geometric (default), binomial since 1.2.0 | Geometric, Weibull CDF, Weibull PDF | Geometric, delayed, Weibull PDF, Weibull CDF, binomial, none, custom |
| Weights normalised | Yes | No: geometric adds up to 1 / (1 - θ) | Yes by default |
| Delayed peak possible | No | Yes, Weibull PDF | Yes, delayed adstock and Weibull PDF |
| Carryover window | max_lag, default 8 | Whole series for geometric | l_max, set by you |
| Saturation | Hill; slope fixed at 1 for ordinary channels; reach and frequency channels saturate on frequency | Hill with alpha (shape) and gamma (inflexion) | Logistic, Hill, Michaelis-Menten, tanh, root, log, custom |
| Order | Adstock then Hill by default, switchable | Adstock then Hill | Adstock then saturation by default, switchable |
Sources: Meridian docs,¹⁴ Robyn docs⁹ and PyMC-Marketing code.¹²
The normalisation row matters more than it looks. Robyn's geometric adstock is recursive:
is spend in week t and the share carried into the next week. A one-off 100 with becomes 100, 60, 36, 21.6, 12.96, 7.78 and so on, summing to 100 / (1 - 0.6) = 250. Meridian and PyMC-Marketing divide by the sum of the weights:
L is the maximum lag and the weight at lag l, for geometric decay; Meridian's binomial alternative is . Here the same 100 stays 100 in total and is only spread over time. A Robyn coefficient and a Meridian coefficient on the "same" channel are therefore on different scales by design, one more reason never to compare parameters across tools.
Binomial weights fall from lag 0 just like geometric ones, only more slowly, so Meridian cannot represent an effect that peaks weeks after the spend.¹⁴ Robyn's Weibull PDF (a shape above 2 delays the peak) and PyMC-Marketing's delayed adstock can. For a loan disbursed weeks after the application that matters; more on it in the Kazakhstan section.
Saturation in all three is built on the Hill curve:
x is adstocked spend, ec the half-saturation point (the spend at which the channel delivers half its maximum effect) and s the slope. Robyn parameterises it with alpha for s and gamma for ec, and the meaning of gamma changed in v3.12.0. From 3.12.0 on:⁶
Up to and including 3.11.1:
is adstocked spend in week t. In the old definition ec sat between the minimum and the maximum of adstocked spend; now it is a share of the maximum. The same gamma gives a different curve in the two versions. Robyn suggests alpha between 0.5 and 3 and gamma between 0.3 and 1.
Meridian fixes s = 1 for ordinary channels, which makes every curve concave. With ec = 100, spend of 50, 100, 200 and 400 delivers 0.333, 0.5, 0.667 and 0.8 of the maximum (x / (x + 100)), so each doubling adds less. The reason is practical: with concave curves the budget optimiser finds a global optimum. The price is that an ordinary channel can never show a threshold, the S-shape where the first spend does little. If you believe TV needs a minimum weight before it works, Robyn's alpha above 1 or PyMC-Marketing's Hill can express that. Meridian's reach-and-frequency channels are the exception: they apply a learned Hill curve to frequency and multiply it by reach.¹⁰
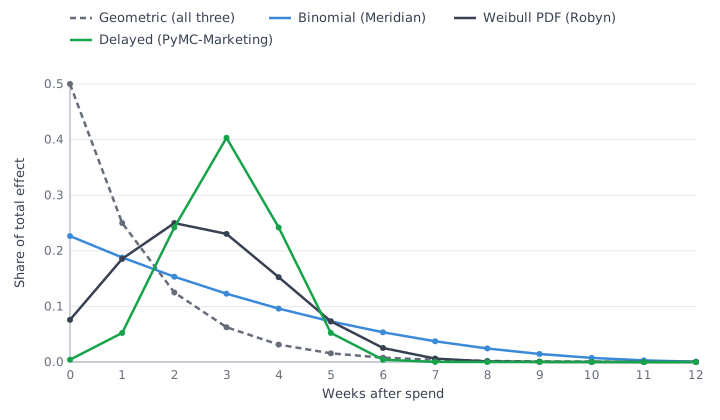
All three offer geometric decay. Meridian adds a binomial decay that keeps more weight in later weeks, Robyn a Weibull PDF that can peak after the week of spend, and PyMC-Marketing a delayed adstock whose peak is a parameter. With the parameters in the figure the Weibull PDF peaks 2 weeks after spend and the delayed adstock 3.
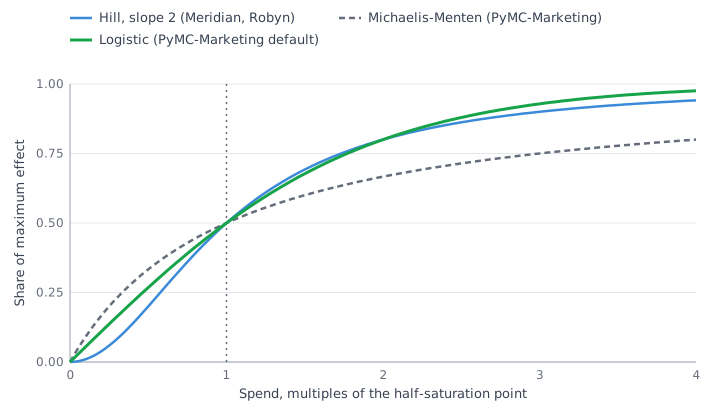
Scaled to the same half-saturation point the curves agree there and part elsewhere: at twice that spend Hill with slope 2 and the logistic curve both give 0.80 of the maximum and Michaelis-Menten 0.67. Below it Hill with slope 2 starts flat, which is the threshold effect a concave curve cannot show.
Calibration with experiments: three different mechanisms
This is where the tools differ most, and where the choice should be made if you run experiments. The running example is the geo test from the geo experiments guide: a heavy-up that added 20 $k on top of business-as-usual spend over four weeks and produced 33.2 $k of incremental revenue, an iROAS of 33.2 / 20 = 1.66. A heavy-up is a useful example precisely because the three tools treat it differently.
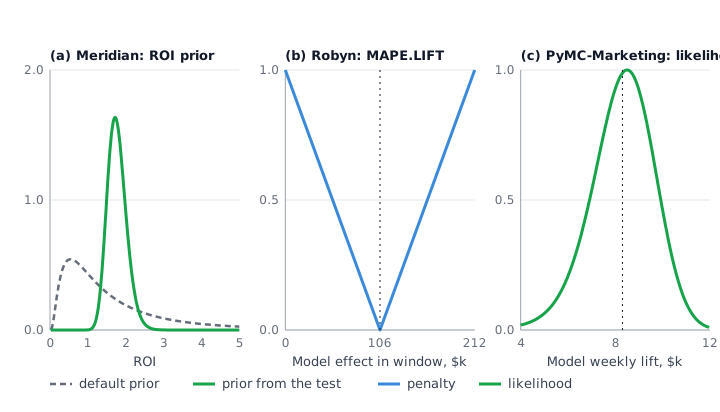
The figure gives each framework the experiment it is built for. Meridian's ROI prior and Robyn's lift calibration need a counterfactual of zero spend, so they get the go-dark test from the Meridian article: video switched off for four weeks, $60k of spend withheld, an ROI of 1.77 with a standard error of 0.25. Meridian turns it into a prior, a log-normal with μ = 0.561 and σ = 0.141 on the log scale. Robyn takes the revenue the test lost, $106.2k, and penalises models in proportion to how far their video effect over the test window lands from it. PyMC-Marketing compares two points on its response curve, so it can take the heavy-up from the geo experiments article as data: a likelihood that peaks near the measured weekly lift.
Meridian: the experiment becomes the ROI prior
Because the prior sits on ROI, a test against zero spend (a holdback or go-dark design) translates directly: centre the channel's ROI prior on the measured iROAS and set its width from the test's standard error. Helper functions build a LogNormal from a mean and a standard deviation. Since 2.0.0 the CalibrationBuilder does this from a Meridian GeoX result (incremental effect per dollar, its standard deviation, business-as-usual spend and dates) and widens the prior for known mismatches:¹¹
is the experiment's standard error, and each adds variance: when test spend differs from the channel's usual spend, for older tests, when the test was shorter than the carryover window, for your own judgement. Recency uses a 52-week half-life:
a is the age of the experiment in weeks. A one-year-old test gets and , which on its own widens by .
The docs are clear that no single formula turns an experiment into a prior, and the trap they describe, an experiment whose counterfactual is not zero spend, is exactly our example: the MMM counterfactual is zero spend, while a heavy-up measures the return on extra spend above the usual level. The CalibrationBuilder assumes a zero-spend counterfactual. On a concave curve, and Meridian's curves for ordinary channels are concave, the average return from zero is at least the return on any increment above the current level, so 1.66 is closer to a floor for the channel's ROI than to its centre. My approach for a heavy-up is to use it for the lower part of the ROI prior, or as evidence for an mROI prior, rather than to centre the ROI prior on it.
Two caveats as of October 2026. The open-source GeoX package currently runs only the time-based regression (TBR) estimator, although its paper also describes synthetic control methods.¹⁵ And the Meridian changelog lists an unreleased fix that makes calibrated ROI priors on the JAX backend match TensorFlow, so in 2.1.0 the two backends may disagree.²
Robyn: the experiment becomes a third objective
You pass a table with the channel, start and end dates, the absolute lift, the spend, a confidence value, the metric and a calibration scope. MAPE.LIFT compares the lift with the model's contribution of that channel over those dates, and only the 10% of models closest to it reach the Pareto front. The analyst guide is explicit that Robyn only accepts a point estimate,¹⁶ so a test with a narrow interval and a test with a huge one pull equally hard. The scope setting decides whether the model's carryover beyond the test window counts ("total") or not ("immediate"). Robyn takes results from conversion lift studies and geo experiments, for example from Meta's GeoLift.
The comparison fits a holdout design, where the lift is the channel's whole contribution, which is the example the guide gives. Our heavy-up measured only the increment from the extra 20 $k. Entered as is, 33.2 would be compared with the channel's entire contribution over four weeks and would drag it down, so a heavy-up needs translating before Robyn sees it, or it should stay out.
PyMC-Marketing: the experiment becomes data
add_lift_test_measurements takes, per channel and optionally per region, the spend level before the test x, the extra spend , the measured lift and its standard deviation . The docs describe a lift test as two points on the channel's saturation curve, and the model adds a likelihood term:¹⁷
h is the channel's saturation curve including its coefficient, so the posterior has to explain the measured lift through the shape of the curve between x and , weighted by the test's precision. This is the one mechanism of the three built for a heavy-up, with one catch: the two points sit on the model's weekly, per-region curve, and the method does not add up predictions over the test window. Window totals therefore have to be converted first. For the series' 4-week heavy-up that gives = 20 / 4 = 5, = 33.2 / 4 = 8.3 and = 5.24 / 4 ≈ 1.31 ($k per week), with x the weekly business-as-usual spend. That is valid only if spend was steady and the test was long compared with the channel's carryover, and carryover that lands after the test is missing from . The geo experiments article walks through the conversion. Since 1.0.0, add_cost_per_target_calibration adds a Normal likelihood on a channel's cost per target or ROAS over a period.³
| Meridian | Robyn | PyMC-Marketing | |
|---|---|---|---|
| The experiment enters as | Prior on channel ROI | Third objective, MAPE.LIFT | Extra likelihood term |
| Experiment uncertainty used | Yes, it sets the prior width | No, point estimate only | Yes, σ in the likelihood |
| What it constrains | The level of ROI | Contribution over the test dates | The saturation curve between two spend levels |
| Natural test design | Holdback or go-dark, zero-spend counterfactual | Holdout, lift equals the channel's contribution | Heavy-up or any test with two spend levels |
| Experiments per region | Through the channel's prior | No regional model | Yes, one column per model dimension |
Google's measurement playbook gives a rule that works with any of the three: differences of 5-10% between MMM and experiment are acceptable, above 10% calibrate, and calibrating a whole channel from a single experiment is listed as a pitfall.¹⁸
Regions, time-varying effects and the baseline
Meridian is geo-hierarchical by default, as shown above. The KPI is modelled per capita, channels bought only nationally are spread to regions by population, and the time effect is built from knots: values at chosen weeks, linearly interpolated in between. In a geo model the default is one knot per week, which works because all regions share the time effect; in a national model the default is a single knot, so seasonality has to come from more knots or from controls. Media effects vary by region, not over time.¹⁰
Robyn models one time series. Its input check stops with an error on duplicated dates, labelled panel data, so a regional analysis means either one national model or one model per region with no pooling between them.⁶ The baseline comes from Prophet: Robyn fits Prophet to the KPI and feeds the trend, season and holiday components (plus weekday for daily data) into the ridge regression as regressors. Media coefficients are constant over the modelling window. One risk I watch for: Prophet's trend is fitted to the KPI itself, so a trend that coincides with a spend ramp-up can absorb part of the media effect.
PyMC-Marketing accepts any dimensions, for example dims=("geo",). Pooling is your decision through the priors: the defaults give each region its own parameters without a hierarchy, so for partial pooling you write hierarchical priors yourself. Seasonality comes from Fourier terms; a time-varying intercept and time-varying media effects are available through a Hilbert-space approximate Gaussian process (HSGP), with one media multiplier shared across channels by default.¹² It is the only one of the three that lets media efficiency drift over time out of the box.
Budget optimisation, validation and compute
Budget optimisation
- Meridian: a fixed budget that maximises ROI (each channel within ±30% of historical spend by default), or a flexible budget up to a target total ROI or a target marginal ROI per channel (channel bounds 0-200%).¹⁹ The Scenario Planner, in open beta since February 2026, puts these scenarios in a no-code interface.²⁰
- Robyn: robyn_allocator with two scenarios, maximum response for a fixed budget or target efficiency (by default 80% of the initial ROAS or 120% of the initial CPA), solved with nloptr; channel limits are multiples of historical average spend.⁹
- PyMC-Marketing: a budget optimiser on SciPy's SLSQP that works on posterior samples, with risk-aware objectives such as value at risk, conditional value at risk and the Sharpe ratio.¹²
Whichever you use, Google's playbook recommends moving no more than 20% of a channel's spend at a time.¹⁸ The optimiser extrapolates the curve; the market does not have to follow it.
Validation
- Meridian: holdout weeks or regions (declarative holdout specs since 2.1.0), R², MAPE and weighted MAPE on train and test, and health checks: convergence (R-hat below 1.2 passes), the probability of a negative baseline, a Bayesian posterior predictive p-value and how far ROI posteriors moved from their priors.²¹
- Robyn: a time-ordered train, validation and test split, with the training share itself a hyperparameter (0.5 to 0.8 by default), and plots that show whether the objectives converged.⁹
- PyMC-Marketing: rolling time-slice cross-validation, posterior predictive checks and out-of-sample forecasts with credible intervals.¹²
Compute
- Meridian recommends at least one GPU and was tested on a T4 with 16 GB; JAX has been the default backend since 2.0.0. A GPU is a recommendation, not a requirement.²²
- Robyn is CPU-bound and parallel: by default it uses all cores but one, for at least 2,000 iterations times 5 trials, and it needs Python with Nevergrad next to R.⁶
- PyMC-Marketing runs on CPU by default; NUTS can be switched to BlackJax, NumPyro (both on JAX) or Nutpie, and PyMC's backends allow GPU acceleration.¹²
On data volume the stated minimums are close. Robyn's guide asks for at least two years of weekly data and about 10 observations per variable.¹⁶ Meridian asks for two years of weekly data for a geo model and suggests three for a national one, showing that 26 parameters on 104 weekly points is too few to estimate reliably.²³ I found no fixed minimum in PyMC-Marketing's docs; the same arithmetic applies.
The full comparison
| Meridian | Robyn | PyMC-Marketing | |
|---|---|---|---|
| Maintainer | Meta Marketing Science | PyMC Labs | |
| Version as of October 2026 | 2.1.0 (17 Sep 2026) | 3.12.1 on CRAN (2 Jul 2025) | 1.2.0 (29 Sep 2026) |
| Licence | Apache-2.0 | MIT | Apache-2.0 |
| Language | Python 3.11-3.13 | R plus Python for Nevergrad; robynpy is a beta | Python 3.12 or newer |
| Estimation | Bayesian, NUTS; JAX backend by default | Ridge regression (glmnet) inside a Nevergrad multi-objective search | Bayesian, NUTS; PyMC, BlackJax, NumPyro or Nutpie samplers |
| Model selection | One model plus health checks | Pareto front on NRMSE and DECOMP.RSSD, clustered; you choose | One model; you compare variants |
| Uncertainty | Posterior, 90% credible intervals by default | Bootstrap 95% interval for ROAS within a cluster | Posterior, credible intervals |
| Priors | On ROI by default, LogNormal(0.2, 0.9) | Implicit: bounds, ridge penalty, DECOMP.RSSD | On coefficients by default, all replaceable |
| Adstock | Geometric, binomial; normalised; max_lag 8 | Geometric, Weibull CDF, Weibull PDF | Geometric, delayed, Weibull, binomial, custom |
| Saturation | Hill, slope 1 for ordinary channels; reach and frequency | Hill (alpha, gamma) | Logistic, Hill, Michaelis-Menten, tanh and others |
| Experiment calibration | Experiments set ROI priors; CalibrationBuilder reads GeoX | MAPE.LIFT objective, point estimates only | Lift tests as Gamma likelihood; CPA or ROAS as Normal likelihood |
| Regions | Hierarchical by default | One time series per model | Any dimension; pooling set by your priors |
| Baseline | Knots | Prophet trend, season, holidays | Fourier seasonality, events, optional GP intercept |
| Time-varying media effects | No | No | Yes, HSGP |
| Budget optimiser | Fixed budget, target ROI, target mROI; Scenario Planner | Max response or target efficiency (nloptr) | SLSQP with risk-aware objectives |
| Validation | Holdout specs, R², MAPE, wMAPE, health checks | Time-ordered train, validation, test | Time-slice cross-validation, posterior predictive checks |
| Compute | At least 1 GPU recommended | CPU, multi-core | CPU by default; JAX samplers, GPU possible |
| Stated data minimum | 2 years weekly geo, 3 years national | 2 years weekly, 10 observations per variable | None stated in the docs I checked |
| Learning curve (my judgement) | Medium: Python and Bayesian basics | Low for R users; reading the Pareto set is the hard part | High: you design the model |
| Time to first model (my judgement) | Medium | Fastest for a national model | Slowest |
| Best fit (my judgement) | Python teams with regional data and an experiment programme | R teams that need a national model quickly | Teams with Bayesian skills that need a custom structure |
The last three rows are judgement from my projects, not documentation. Every other cell comes from the sources above.
Tools that sit next to an MMM
| Tool | What it is | Status as of October 2026 | Use it for |
|---|---|---|---|
| Meridian GeoX¹⁵ | Google's geo experiment design and analysis, Python, Apache-2.0 | 1.0.0 released 1 Sep 2026; the open-source code runs TBR only | Experiments that feed Meridian's ROI priors |
| GeoLift²⁴ | Meta's geo experiment package in R, augmented synthetic control | GPL (≥ 2); not on CRAN; last release v2.6.06 (May 2023), version 2.7.5 on main | Geo tests; recommends 20+ geo units and 25+ pre-test periods; no built-in iROAS, compute it from lift and spend |
| CausalImpact²⁵ | Google's R package, Bayesian structural time series | 1.4.1 (26 Sep 2025)²⁶ | The effect of one intervention on one series; not a mix model |
| Orbit²⁷ | Uber's Python forecasting library with Stan and Pyro backends and kernel-based time-varying regression | 1.1.5.1 (22 May 2026) | Time-varying regression you build an MMM around |
| Recast²⁸ | Commercial managed MMM | Bayesian hierarchical time-series model fitted in Stan; time-varying parameters, ROI included, via a Gaussian process | Buying a managed service |
Experiments are what turns any of the three from a fitting exercise into a measurement system; the design side is covered in the GeoX and GeoLift guide.
A decision table
| Situation | Choose |
|---|---|
| No analyst in house who can own the model | A managed vendor or certified partner |
| R-only team that needs a national model within weeks | Robyn, pinned to a version and calibrated |
| R-only team with time | Move the work to Python, then choose below |
| Python team, spend and KPI by region | Meridian geo model, experiments as ROI priors |
| Python team, regional data, plus custom pooling, drifting effects or lift tests as data | PyMC-Marketing |
| Python team, national data only, strong Bayesian experience | PyMC-Marketing |
| Python team, national data only, basic Bayesian experience | Meridian national model on three years of weekly data |
The questions are in the order I ask them. Ownership and language come first, because a technically better tool that nobody on the team can maintain loses to a simpler one that somebody can.
Team, cost and data in Kazakhstan and the CIS
Skills
Most analytics teams I work with in the region write Python and SQL; R is the exception. Robyn needs both runtimes, R for the package and Python for Nevergrad through reticulate, which doubles the environment you have to keep alive. Meridian needs Python 3.11 to 3.13 and PyMC-Marketing 3.12 or newer, so check the corporate Python image before planning the project. The bigger skill gap is Bayesian: Meridian's defaults let a careful analyst get a sound first model, while PyMC-Marketing assumes someone who can write a prior, read a trace plot and explain why a chain did not converge.
GPU and security
Meridian recommends a GPU. Cloud GPU workspaces are available from the large cloud providers; in banks the blocker is usually the security review, not the price. MMM inputs are aggregated weekly spend and outcomes by region with no personal data, which makes that review easier, but spend levels are commercially sensitive, so start the review before the project, not in week three. If cloud is off the table, a national Meridian model runs on CPU, more slowly; PyMC-Marketing and Robyn are CPU tools anyway.
About 20 regions, two of them dominant
Kazakhstan has 17 oblasts and 3 cities of republican significance, about 20 geo units against 210 US media markets. Meridian's US guidance works with the top 50 to 100 markets and suggests dropping the smallest geos by KPI first;²³ GeoLift recommends more than 20 geo units for experiments.²⁴ Twenty units still give a geo model far more data points than a national one, but Almaty and Astana dominate the totals and much of the media is bought nationally. What I do:
- Check how much of each channel's spend is genuinely geo-targeted. A national TV buy or an untargeted digital campaign gets spread to regions by population in Meridian, which adds rows but no information.
- Merge the smallest oblasts whose weekly KPI is mostly noise, and document the merge.
- If geo-targeted spend is a small share, build a national model on three years of weekly data and put the effort into experiments instead.
- In PyMC-Marketing, write hierarchical priors explicitly; the per-region defaults leave each small region on its own.
Offline conversions
For banks, insurers and superapps the KPI often closes offline: a branch visit, a call-centre sale, a loan disbursed days or weeks after the application. Three consequences for the tool choice:
- The KPI must be a count or an amount that adds up across regions and weeks, which Meridian requires explicitly. Model disbursements or applications, never a conversion rate.
- Assign every conversion to a region by one fixed rule, branch region or customer residence, and keep it stable over the whole history. How to capture these conversions in the first place is covered in offline branch attribution for banks.
- If the effect peaks weeks after the ad, you need a delayed-peak adstock: Robyn's Weibull PDF or PyMC-Marketing's delayed adstock. Meridian's geometric and binomial shapes both peak in the week of spend; binomial only makes the tail longer. The alternative is to model an earlier KPI, such as applications, and translate it.
Managed vendors
I will not quote prices; they depend on scope and change often. The comparison that matters is the vendor fee against the internal cost of an analyst who builds and refreshes the model, plus the experiment programme that keeps it honest. A vendor removes the modelling, not the data pipeline and not the experiments. Before signing I ask any vendor for:
- The model in writing: estimation method, priors, adstock and saturation forms.
- How experiments enter: as priors, as likelihood terms, or as a check after the fact.
- The out-of-sample test they report, and on what holdout.
- The ROI definition: period, counterfactual, carryover window, revenue or conversions.
- The right to export the weekly input table and every model output if we leave.
Google lists certified Meridian partners (more than 20 at the January 2025 launch),¹ and Recast publishes its model's technical documentation,²⁸ which is the level of transparency I would expect from any vendor.
Common mistakes
Choosing by popularity
GitHub stars and conference talks measure how well a tool is known, not how well it fits your data. Robyn is widely known and frozen; that combination is a risk, not a recommendation. The questions that decide are which language your team writes, whether you have regional data and how you will use experiments.
Trusting one model from the Pareto front
Robyn returns a set of nearly equivalent models on purpose. Look at the spread of each channel's ROAS across clusters: if it ranges from loss-making to excellent, the data cannot tell, and that channel needs an experiment. The Bayesian version of the same mistake is reporting the posterior mean without its interval.
Comparing ROI across tools with different definitions
Robyn's ROAS is decomposed contribution over spend on unnormalised adstock. Meridian's ROI is incremental outcome against zero spend within its max_lag window, summarised from a posterior. Meridian's marginal ROI is the return on 1% more spend; Robyn's marginal ROAS is read off the response curve at a spend level. Align the period, KPI, counterfactual, carryover window and average against marginal before you put two numbers side by side.
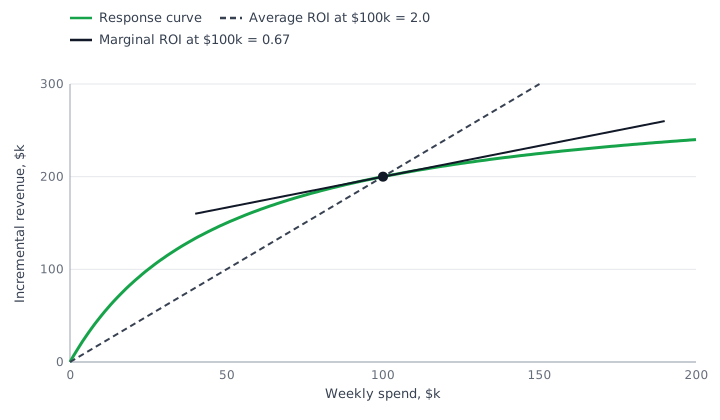
The gap between average and marginal alone can be threefold. On a response curve with a maximum of 300 $k and half-saturation at 50 $k of weekly spend, revenue at 100 $k is 300 × 100 / (100 + 50) = 200 $k, so the average ROI is 200 / 100 = 2.0, while the marginal ROI, the slope 300 × 50 / (100 + 50)², is about 0.67.
Version drift
Robyn changed the Hill inflexion in v3.12.0, so the same gamma means a different curve than in 3.11.x, and robynpy was translated from 3.11.1. Meridian 2.0.0 switched the default backend to JAX, calibrated ROI priors on JAX may not match TensorFlow until an unreleased fix ships, and 2.1.0 deprecated array arguments such as roi_calibration_period. PyMC-Marketing 1.0.0 made the multidimensional model the default class. Pin versions and store the exact version next to every model output.
One experiment does not calibrate a channel
A test measures one period, one spend level and one set of regions. Google's playbook lists calibrating a whole channel from a single experiment as a pitfall. Plan a series, and in PyMC-Marketing or Meridian let the experiment's own uncertainty set how hard it pulls.
Next step
The practical next step is the same for every option: build the weekly table of spend, impressions, KPI and controls by region, because it feeds all three tools and its quality decides more than the choice of framework.
Sources
¹ Meridian is now available to everyone - Google blog, January 2025
² Meridian CHANGELOG - Google, GitHub
³ PyMC-Marketing 1.0.0 release notes - PyMC Labs, GitHub
⁴ pymc-marketing release history - PyPI
⁵ Robyn: Semi-Automated Marketing Mix Modeling - CRAN
⁶ Robyn repository and source code - Meta Marketing Science, GitHub
⁷ robynpy - PyPI
⁸ LightweightMMM repository (archived) - Google, GitHub
⁹ Robyn features and methodology - Meta
¹⁰ Meridian model specification - Google for Developers
¹¹ Calibrate treatment priors with experiments - Meridian, Google for Developers
¹² PyMC-Marketing repository and README - PyMC Labs, GitHub
¹³ Chan, Perry (2017) Challenges and Opportunities in Media Mix Modeling - Google Research
¹⁴ Set the adstock_decay_spec parameter - Meridian, Google for Developers
¹⁵ Meridian GeoX - Google for Developers
¹⁶ An analyst's guide to MMM - Robyn docs, Meta
¹⁷ Lift test calibration - PyMC-Marketing docs
¹⁸ Modern Measurement playbook, March 2024 - Google
¹⁹ Budget optimization scenarios - Meridian, Google for Developers
²⁰ New Meridian tool puts MMM insights directly in marketers' hands - Google blog, February 2026
²¹ Model health checks - Meridian, Google for Developers
²² Meridian repository and README - Google, GitHub
²³ Amount of data needed - Meridian, Google for Developers
²⁴ GeoLift repository - Meta, GitHub
²⁵ Brodersen et al. (2015) Inferring causal impact using Bayesian structural time-series models - Annals of Applied Statistics
²⁶ CausalImpact - CRAN
²⁷ Orbit repository - Uber, GitHub
²⁸ Recast model technical documentation - Recast
FAQ
Can we run Robyn and Meridian side by side and average the results?
Running two tools on the same data is a useful robustness check, but averaging their ROIs mixes different definitions: unnormalised against normalised adstock, a ridge decomposition pulled toward spend shares against a posterior pulled toward your priors. Use the disagreement instead. The channels where the two tools differ most are the first candidates for an experiment.
Does Meridian favour Google channels because Google built it?
The code is open source under Apache-2.0, and the default ROI prior is the same LogNormal(0.2, 0.9) for every paid channel, so nothing in the specification favours Google. Bias can come from the inputs: a channel with richer data, such as reach and frequency or clean regional splits, gets a better identified estimate than one with a single national spend line. Check data quality per channel before reading the ranking.
Do we need a GPU for PyMC-Marketing or Robyn?
No. Robyn runs on CPU and spreads the search across cores. PyMC-Marketing runs on CPU by default and can switch to JAX-based samplers such as NumPyro or BlackJax, which can use a GPU if you have one. Meridian is the one that recommends a GPU, and even it runs on CPU, more slowly.
If we start with one framework, can we switch later without losing the work?
Most of the work is the weekly input table (spend, impressions, KPI and controls by region) and the experiment log (dates, spend, lift and its standard error), and both carry over to any tool. Fitted parameters and hyperparameter bounds do not: adstock normalisation, the Hill definition and the prior parameterisation differ, so you refit and re-validate. Keep the data layer tool-agnostic from day one.
Is Robyn still acceptable for a bank in 2026?
Technically yes: version 3.12.1 is on CRAN and the code is MIT-licensed. The risk is maintenance, because nobody has committed to the main branch since June 2025, so bugs and dependency breakages are yours to fix. If you use it, pin the whole R and Python environment in a container, record the version next to every result and plan an exit to a maintained framework.
Seeing this in your own funnel?
Two weeks, fixed scope, read-only access. You get the findings and a 90-day roadmap whether or not we work together afterwards.